Smart Meter Reads (MX02US05)
1. Problem Statement
Meter Reading Supervisor Pain Points:
- Cannot efficiently track the status and progress of multiple read cycles across different routes
- Lacks visibility into performance metrics for individual routes and specific meters
- No clear options to retry failed reads or resolve issues promptly
- Has limited ability to identify and address common failure patterns in the reading process
- Cannot easily monitor the distribution of successful, failed, and pending readings
- Struggles to meet cycle completion deadlines due to limited tracking capabilities
Core Problem: The current meter reading management system lacks comprehensive tracking and performance monitoring capabilities for smart meter readings, resulting in inefficient reading collections, delayed cycle completions, and quality control issues across the utility service areas. Without proper visibility into cycle performance and route status, the Meter Reading Supervisor cannot effectively manage the meter reading operation, leading to billing delays and potential revenue loss.
2. Who Are the Users Facing the Problem?
Meter Reading Supervisor:
- Responsible for overseeing meter reading operations across multiple routes
- Manages reading schedules aligned with billing cycles
- Monitors reading performance and coordinates exception handling
- Reports on reading completion rates and efficiency metrics
- Ensures timely data collection for billing processing
The Meter Reading Cycles feature should be accessible to the Meter Reading Supervisor role and potentially to other management roles that need visibility into meter reading operations.
3. Jobs To Be Done
For Meter Reading Supervisor: When I need to monitor the progress of multiple meter reading cycles across different routes, But I lack a consolidated view of cycle statuses and completion rates, Help me track all active and completed cycles with detailed performance metrics, So that I can ensure timely completion of readings for billing cycles.
For Meter Reading Supervisor: When I need to identify and resolve failed meter readings, But I cannot easily see which meters have failed and why, Help me view categorized failure reasons with options to retry failed readings, So that I can improve reading success rates and address systematic issues.
For Meter Reading Supervisor: When I need to report on meter reading performance, But I don't have access to comprehensive metrics and visualizations, Help me access detailed analytics on read success rates, completion percentages, and average read times, So that I can identify opportunities for improvement and report accurately to management.
For Meter Reading Supervisor: When I need to investigate specific meter issues within a cycle, But I cannot easily search for and access individual meter data, Help me search and filter meter records with detailed status information, So that I can quickly address customer inquiries and technical issues.
4. Solution
The Meter Reading Cycles feature provides a comprehensive dashboard and management system for tracking, analyzing, and improving the performance of smart meter reading operations. The solution includes:
Cycle Monitoring Capabilities
- Cycle Overview Dashboard: Real-time dashboard showing active cycles, completion rates, and key performance indicators
- Cycle Status Tracking: Visual indicators of cycle status (In Progress, Completed) with progress percentages
- Cycle Timeline Management: Clear display of cycle dates including last run, next run, and due dates
Route Management
- Route Performance Visualization: Graphical representation of route completion status across different areas
- Route Comparison: Ability to compare performance metrics across different routes
Reading Status Tracking
- Status Distribution Analytics: Visual breakdown of reading statuses (Success, Failed, Pending)
- Failure Analysis: Categorization and quantification of failure reasons (Timeout, Connection Error, Device Offline)
Meter-Level Management
- Detailed Meter Records: Comprehensive view of individual meter statuses and reading data
- Failure Resolution Tools: Options to retry failed readings directly from the interface
- Consumption Validation: Display of current and previous readings with consumption calculation
Search and Filter
- Advanced Search Functionality: Ability to search cycles by name and meters by ID, consumer, or account
- Multi-criteria Filtering: Filter meters by status (Success, Failed, Pending)
- Export Capabilities: Export filtered data for reporting and analysis
5. Major Steps Involved
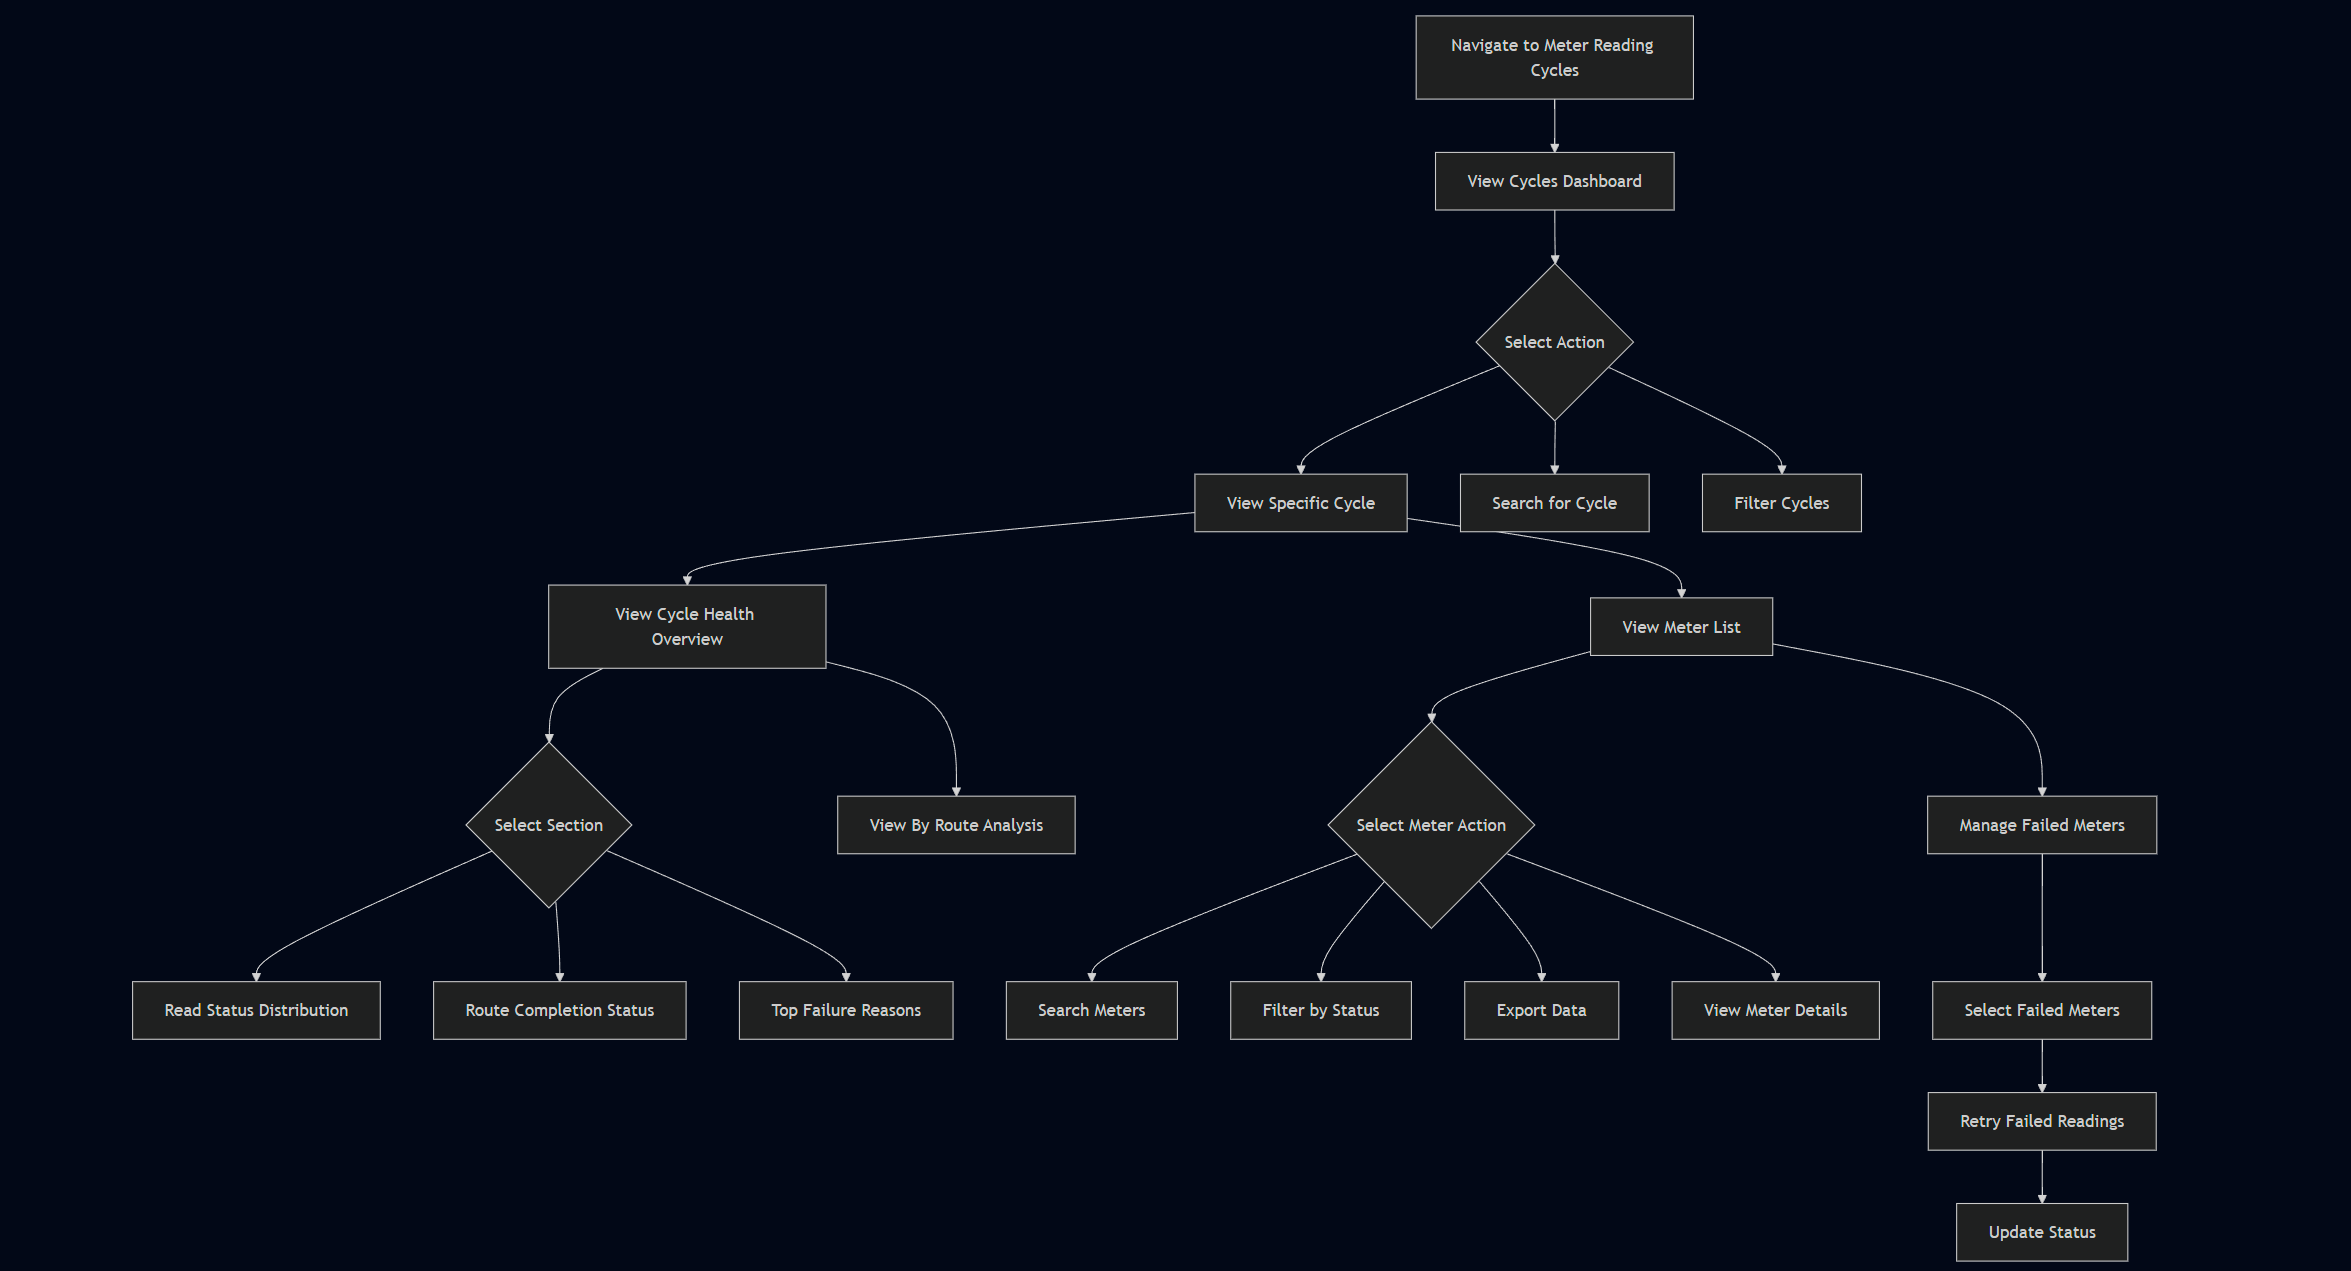
Viewing Cycle Overview
Monitoring Cycle Progress
- Identify cycles that require attention based on status, completion percentage, and due dates
- Click "View" on a specific cycle to access detailed information
- Review the cycle health overview showing read status distribution and route completion status
- Analyze the top failure reasons to understand common issues
- Monitor the progress bar indicating how many reads have been completed out of total reads
Managing Failed Readings
- On the cycle detail page, click on the "Failed Reads" tab to see all failed meters
- Review the list of failed meters with details on failure reasons
- Select one or multiple failed meters
- Click "Retry Failed" to attempt to read the selected meters again
- Monitor the status change of retried meters
Investigating Individual Meters
- Use the search function to find a specific meter by ID, consumer, or account
- Apply status filters (All, Success, Failed, Pending) to narrow down results
- Click on a meter record to view full details
- Review the meter's reading history, current status, and consumption data
- Take appropriate action based on the meter's status (e.g., retry failed readings)
Analyzing Route Performance
Exporting Data for Reporting
- Apply desired filters to the meter list
- Click the "Export" button
- Select the export format and options
- Download the exported file
- Use the data for reporting or further analysis
6. Flow Diagram
7. Business Rules
Meter Reading Cycles Screen - Fields and Business Rules
Dashboard Fields (Top Section)
- Active Cycles
- Field Type: Numeric counter
- Data Source: Count of cycles with status "In Progress"
- Business Rules:
- Must be less than or equal to the total cycles value
- Calculated as: Total Cycles - Completed Cycles
- Completion Rate
- Field Type: Percentage
- Data Source: Calculated field
- Business Rules:
- Formula: (Sum of (Completion Percentage × Number of Meters) for all cycles) ÷ (Total Meters across all cycles)
- Weighted average that accounts for different meter counts per cycle
- Displayed as percentage with % symbol
- Completed Cycles
- Field Type: Numeric counter
- Data Source: Count of cycles with status "Completed"
- Business Rules:
- Cycles are counted as completed when Completion = 100%
- Formula: Count of cycles where Status = "Completed"
- Average Read Time
- Field Type: Time measurement
- Data Source: Calculated field from meter reading timestamps
- Business Rules:
- Formula: Sum of all individual meter reading durations ÷ Total number of meters read
- Displayed in seconds with decimal precision
- Calculated across all cycles
Search Field
- Search Input
- Field Type: Text input filter
- Data Source: User input
- Business Rules:
- Filters the cycles table based on partial or full matches in the Cycle Name field
- Case-insensitive matching
Table Features and Controls
Table Search Functionality
- The table should be searchable by:
- Cycle Name (primary search field - already implemented via the search input)
- Month
- Status
- Due Date
Table Sorting Functionality
- The table should be sortable by all columns, specifically:
- Cycle Name (A-Z, Z-A)
- Status (Completed first/last)
- Month (chronological/reverse chronological)
- Consumers (numeric high/low)
- Meters (numeric high/low)
- Completion (percentage high/low)
- Last Run (date newest/oldest)
- Next Run (date newest/oldest)
- Due Date (date nearest/furthest)
Table Filtering Functionality
- The table should support filtering by:
- Status (dropdown: All, In Progress, Completed)
- Month (dropdown: All, January through December)
- Completion Range (slider or min/max input: 0-100%)
- Due Date Range (date picker: from/to)
- Meters Range (numeric range: min/max)
Table Export Functionality
- The table should support exporting in multiple formats:
- CSV (for data analysis)
- PDF (for reporting)
- Excel (for detailed analysis)
- Export options should include:
- All data or filtered data only
- Selected columns or all columns
- Include/exclude summary statistics
Table Header Fields
- Cycle Name
- Field Type: Text identifier
- Data Source: System-generated or admin-defined name
- Business Rules:
- Primary identifier for each meter reading cycle
- Naming convention: "[Month] Cycle - Route [Direction/Area]"
- Unique identifier for each cycle
- Status
- Field Type: Status indicator
- Data Source: Derived from Completion percentage
- Business Rules:
- "Completed" when Completion = 100%
- "In Progress" when 0% < Completion < 100%
- Visually distinguished by color coding
- Month
- Field Type: Text (month name)
- Data Source: Administrative assignment or cycle creation date
- Business Rules:
- Represents the month when the cycle is scheduled
- Used for organizing and categorizing cycles
- Consumers
- Field Type: Integer
- Data Source: Count from customer database
- Business Rules:
- Count of unique consumer accounts associated with meters in the cycle
- Formula: Count(distinct consumer_ids) where meter_id is in the cycle
- Meters
- Field Type: Integer
- Data Source: Count from meter database
- Business Rules:
- Count of all meters assigned to the cycle
- Formula: Count(meter_ids) in cycle
- Must be a positive integer
- Completion
- Field Type: Percentage with visual progress bar
- Data Source: Calculated field
- Business Rules:
- Formula: (Number of meters read in cycle ÷ Total meters in cycle) × 100
- Displayed as percentage with % symbol
- Progress bar visualization scales proportionally
- Last Run
- Field Type: Date
- Data Source: System timestamp
- Business Rules:
- Records the most recent date when meter readings were collected for this cycle
- Format follows standard date formatting
- Next Run
- Field Type: Date or status text
- Data Source: Scheduling system
- Business Rules:
- Shows the next scheduled date for meter reading activities
- Shows "Not scheduled" when no future date is assigned
- Dependent on scheduling algorithms or manual assignment
- Due Date
- Field Type: Date
- Data Source: Administrative assignment or calculation
- Business Rules:
- Deadline by which the cycle must be completed
- May be calculated based on:
- Formula: Last Run + predetermined cycle duration
- OR Formula: Month End - buffer period
- OR Manually assigned by administrators
- Actions
- Field Type: Interactive buttons
- Data Source: System-defined functionality
- Business Rules:
- Contains action controls related to cycle management
- "View" action provides detailed access to cycle information
- May have conditional actions based on user permissions or cycle status
- Not sortable or filterable as this is a control column
Meter Reading Cycle Detail Screen - Fields and Business Rules
Header Section
- Cycle Name
- Field Type: Text identifier
- Data Source: System-generated or admin-defined name
- Business Rules:
- Displays the currently selected cycle with format "[Month] Cycle - Route [Direction/Area]"
- Must match a valid cycle in the system
- Status Badge
- Field Type: Status indicator
- Data Source: Derived from cycle progress
- Business Rules:
- Displays current cycle status (e.g., "In Progress")
- Visual styling changes based on status (different background colors)
- Scheduled Time
- Field Type: Date and time
- Data Source: Cycle scheduling system
- Business Rules:
- Format: "Scheduled: [Month] [Day], [Time]"
- Represents when the cycle was originally scheduled to begin
- Started Time
- Field Type: Date and time
- Data Source: System timestamp
- Business Rules:
- Format: "Started: [Month] [Day], [Time]"
- Represents actual start time of the cycle execution
- Must be same day or after the Scheduled time
- Progress Bar
- Field Type: Visual progress indicator
- Data Source: Calculated field
- Business Rules:
- Color-coded sections showing success (green), failure (red), and pending (gray)
- Progress calculation: (Completed reads ÷ Total reads) × 100%
- Visual proportions match the actual read status distributions
- Read Counter
- Field Type: Numeric counter with fraction
- Data Source: Meter reading database
- Business Rules:
- Format: "[Completed Reads] / [Total Reads] reads"
- First number represents successfully processed meters
- Second number represents total meters in cycle
- Retry Failed Button
- Field Type: Action button
- Data Source: System functionality
- Business Rules:
- Initiates retry operation for all failed reads in the cycle
- May include dropdown for additional options (indicated by ▼ symbol)
- Enabled only when failed reads exist
Cycle Health Overview Section
- Section Title: Cycle Health Overview
- Field Type: Text header
- Business Rules:
- Serves as container for health metrics
- Consistent visual styling for section headers
- View All Cycles Link
- Field Type: Navigation link
- Data Source: System navigation
- Business Rules:
- Navigates back to main cycles listing page
- Positioned at top-right of the Cycle Health Overview section
Read Status Distribution Subsection
- Read Status Distribution Chart
- Field Type: Donut chart visualization
- Data Source: Calculated from meter reading statuses
- Business Rules:
- Shows distribution of Success, Failed, and Pending reads
- Color-coded sections (Success = green, Failed = red, Pending = gray)
- Percentages calculated as: (Category Count ÷ Total Meters) × 100%
- Must include legend for all status types
Route Completion Status Subsection
- Route Completion Status Chart
- Field Type: Stacked bar chart
- Data Source: Aggregated route completion data
- Business Rules:
- Shows completion status per route (North, South, East, West, Central)
- Y-axis represents percentage (0-100%)
- Stacked bars show proportion of success (green), failed (red), and pending (gray)
- All routes must be represented
Top Failure Reasons Subsection
- Top Failure Reasons List
- Field Type: Ranked list with metrics
- Data Source: Failure categorization system
- Business Rules:
- Shows ranked list of failure reasons (Timeout, Connection Error, Device Offline)
- Each reason includes meter count affected
- Includes horizontal bar visualization of proportion
- Bars colored red to indicate failures
- All Failed Meters Summary
- Field Type: Summary text with count
- Data Source: Calculated total
- Business Rules:
- Format: "Total: [Number] meters"
- Must match sum of all failed meters across categories
Meter List Section
Meter Table
- Meter ID Column
- Field Type: Text identifier with sortable header
- Data Source: Meter database
- Business Rules:
- Format: Standardized ID format (e.g., "MTR" + numeric sequence)
- Serves as primary identifier for each meter
- Must be unique
- Consumer Column
- Field Type: Text with identifier
- Data Source: Customer database
- Business Rules:
- Shows consumer name
- Includes account number below name (smaller text)
- Links to consumer account information
- Premise Column
- Field Type: Text identifier with sortable header
- Data Source: Premise database
- Business Rules:
- Format: Text
- Identifies physical location of meter
- Must be valid premise ID
- Location Column
- Field Type: Hierarchical location
- Data Source: Geographic database
- Business Rules:
- Format: "[Area] > [Type] > [Block]"
- Represents hierarchical location information
- Uses ">" as separator between hierarchy levels
- Last Read Column
- Field Type: Numeric with sortable header
- Data Source: Previous meter reading
- Business Rules:
- Shows previous consumption value
- Used for comparison with current reading
- Format: Numeric with decimal precision
- Current Read Column
- Field Type: Numeric with sortable header
- Data Source: Current meter reading
- Business Rules:
- Shows latest consumption value
- Must be numeric with decimal precision
- Used for consumption calculation
- Consumption Column
- Field Type: Calculated numeric field with sortable header
- Data Source: Calculated field
- Business Rules:
- Formula: Current Read - Last Read
- Shows difference between readings
- Format: Numeric with decimal precision
- Status Column
- Field Type: Status indicator with sortable header
- Data Source: Reading status
- Business Rules:
- Shows status with icon (clock for Pending, checkmark for Success)
- Color-coded for visual identification
- Statuses include: Pending, Success, Failed (not shown in this view)
Table Features and Controls
Table Search Functionality
- The table should be searchable by:
- Meter ID
- Consumer name
- Account number
- Premise ID
- Location
Table Sorting Functionality
- The table should be sortable by all columns, specifically:
- Meter ID (ascending/descending)
- Consumer (alphabetical)
- Premise ID (ascending/descending)
- Location (alphabetical)
- Last Read (numeric high/low)
- Current Read (numeric high/low)
- Consumption (numeric high/low)
- Status (by status type)
Table Filtering Functionality
- The table should support filtering by:
- Status (via tabs and dropdown)
- Route (via "By Route" tab)
- Location components (Area, Type, Block)
- Consumption range
- Read status (Success, Failed, Pending)
Table Export Functionality
- The table should support exporting in multiple formats:
- CSV (for data analysis)
8. Sample Data
Meter Reading Cycles
| Cycle Name | Status | Month | Consumers | Meters | Completion | Last Run | Due Date |
|---|---|---|---|---|---|---|---|
April Cycle - Route West | In Progress | April | 6,000 | – | 75% | Apr 01, 2025 | Apr 15, 2025 |
April Cycle - Route East | Completed | April | 4,200 | – | 100% | Apr 05, 2025 | Apr 12, 2025 |
April Cycle - Route North | In Progress | April | 5,500 | – | 40% | Apr 10, 2025 | Apr 20, 2025 |
April Cycle - Route South | Completed | April | 3,800 | – | 100% | Apr 03, 2025 | Apr 10, 2025 |
April Cycle - Route Central | In Progress | April | 7,200 | – | 21% | Apr 12, 2025 | Apr 25, 2025 |
Meter Data
| Meter ID | Consumer | Premise ID | Location | Last Read | Current Read | Consumption | Status |
|---|---|---|---|---|---|---|---|
MTR100000 | Alice Brown (ACC200000) | PRE300000 | East > Residential > Block D | 92.33 | 110.87 | 18.54 | Success |
MTR100001 | Olivia Rodriguez (ACC200001) | PRE300001 | East > Industrial > Block A | 32.68 | 32.75 | 0.07 | Failed |
MTR100002 | John Rodriguez (ACC200002) | PRE300002 | North > Commercial > Block D | 984.33 | 990.20 | 5.87 | Pending |
Failure Reasons
| Failure Reason | Number of Meters |
|---|---|
Timeout | 42 |
Connection Error | 36 |
Device Offline | 27 |
Other Failures | 38 |
Total Failed Meters | 143 |
9. Acceptance Criteria
- The system must display a dashboard showing key cycle metrics including active cycles, completion rate, completed cycles, and average read time
- The system must list all meter reading cycles with their status, month, meter count, completion percentage, last run date, and due date
- The system must provide a search function that allows users to find cycles by name
- The system must allow users to view detailed information for a specific cycle by clicking on the "View" action
- The cycle detail page must show a progress bar indicating the number of completed reads versus total reads
- The system must display a read status distribution chart showing the percentage of successful, failed, and pending readings
- The system must show a route completion status visualization comparing performance across different routes
- The system must list top failure reasons with the number of affected meters for each reason
- The system must provide tabs to filter meters by status (All, Success, Failed, Pending)
- The system must include a search function to find specific meters by ID, consumer, or account
- The system must display detailed meter information including meter ID, consumer, premise ID, location, last read, current read, consumption, and status
- The system must provide a "Retry Failed" button that allows users to retry readings for selected failed meters
- The system must include an export function that allows users to download meter data in various formats
- The system must update reading statuses in real-time when retry actions are performed
- The system must calculate and display consumption values based on the difference between current and last readings
- The system must clearly indicate cycle due dates and highlight cycles that are at risk of missing deadlines
- The system must provide navigation to view all cycles from any cycle detail page
- The system must display the scheduled and actual start times for each cycle
- The system must allow filtering and sorting of meters based on multiple criteria
- The system must highlight unusual consumption patterns for further investigation
10. Process Changes
| Current Process | New Process | Impact |
|---|---|---|
Manual tracking of meter reading progress through spreadsheets or basic reports | Real-time dashboard showing cycle status, completion rates, and key metrics | Reduces tracking time by ~70% and provides up-to-date visibility |
Limited visibility into reasons for failed readings, requiring extensive investigation | Categorized failure reasons with counts and details | Improves troubleshooting efficiency by 60% through targeted resolution |
Separate systems for viewing cycle status and individual meter issues | Integrated view from cycle overview down to individual meter details | Reduces context switching by 80% and improves investigation efficiency |
Manual process for retrying failed readings through field visits or separate systems | Direct "Retry Failed" functionality from the dashboard | Decreases resolution time for failed readings by 50% via automation |
Static reports requiring manual creation and distribution | Interactive dashboards with export functionality | Reduces reporting time by 75% and improves data accuracy |
Route performance analysis requiring manual data compilation | Built-in route comparison visualizations | Enables data-driven route optimization and performance improvement |
Reactive approach to cycle completion issues | Proactive monitoring with clear due dates and completion tracking | Improves on-time cycle completion rates by 40% |
Isolated meter data requiring multiple lookups | Comprehensive meter details with consumption calculation | Reduces time to access complete meter info by 65% |
11. Impact from Solving This Problem
| Metric | Impact |
|---|---|
Cycle Completion Timeliness | Improves by 30–40% through better tracking and proactive issue resolution |
Reading Success Rate | Increases to 95%+ through better failure management |
Operational Efficiency | Reduces time spent on monitoring and troubleshooting by 60–70% |
Data Quality for Billing | Improves accuracy and completeness of meter data for billing |
Resource Allocation | Enables better scheduling and focus on problematic areas |
Revenue Assurance | Reduces unbilled consumption through better read completion rates |
Staff Productivity | Increases meters managed per staff member through better tools and visibility |
Customer Satisfaction | Improves through more accurate billing and faster issue resolution |
Analytics Capability | Enables data-driven decision making for meter reading operations |
12. User Behavior Tracking
Events to Track
| Event | Properties | Insights | Questions Answered |
|---|---|---|---|
Cycle View |
,
,
| Understanding which cycles require attention | Which cycles are being monitored most frequently? |
Meter Search |
,
,
| Identifying common search patterns | What meters/consumers are frequently investigated? |
Status Filter Applied |
,
,
| Understanding distribution of attention | How much time is spent on failed vs. successful readings? |
Retry Action |
,
,
,
| Measuring retry effectiveness | What is the success rate of retry attempts? |
Export Data |
,
,
| Understanding reporting needs | What data is being exported and how frequently? |
Route Performance View |
,
,
| Tracking focus on routes | Which routes require the most management attention? |
Failure Analysis View |
,
,
| Understanding problem prioritization | What types of failures are being investigated most? |
Dashboard Load Time |
,
,
| Measuring system performance | Is the system performing adequately for users? |
Session Duration |
,
,
| Understanding engagement | How much time do supervisors spend in the system daily? |
Feature Usage Frequency |
,
,
| Identifying valuable features | Which features are most/least used in the system? |
Metrics to Monitor
- Cycle Completion Rate Over Time
- Measures: Percentage improvement in cycle completion rates
- Question: Is the new system improving overall completion performance?
- Average Time to Resolve Failed Readings
- Measures: Time between failure detection and successful retry
- Question: Is the system enabling faster problem resolution?
- User Efficiency Metrics
- Measures: Number of actions per resolved issue
- Question: Is the system making users more efficient?
- Feature Adoption Rate
- Measures: Percentage of available features being regularly used
- Question: Are users taking advantage of all system capabilities?
- Reading Success Rate Trends
- Measures: Percentage of successful readings over time
- Question: Is the system improving the overall success rate?
Wireframe
Wireframe: :Link
Reference: Link
No Comments