Photo Meter Reads (MX02US03)
Utility Meter Compass - Photo Meter Reading Management User Story
1. Problem Statement
Meter Reading Supervisor
- Cannot efficiently track the status and progress of read cycles across different areas
- Lacks visibility into performance metrics for individual routes and meter readers
- Struggles with managing the assignment and reassignment of routes to meter readers
- Has limited ability to identify and address problem areas in the reading process
- Cannot easily monitor quality metrics like normal, faulty, and could-not-read (RCNT) readings
Core Problem
The current meter reading management system lacks comprehensive tracking, assignment, and performance monitoring capabilities for photo meter readings, resulting in inefficient resource allocation, delayed cycle completions, and quality control issues across the utility service areas. Without proper visibility into cycle performance and route status, the Meter Reading Supervisor cannot effectively manage the meter reading operation.
2. Who Are the Users Facing the Problem?
Meter Reading Supervisor
A utility professional responsible for overseeing the entire meter reading operation, ensuring timely and accurate data collection for billing purposes. They manage multiple reading cycles, coordinate meter readers, and report on operational performance. The Meter Reading Supervisor is the primary and sole user of this feature.
3. Jobs To Be Done
For Meter Reading Supervisor:
When I need to monitor the progress of multiple reading cycles across different service areas, But I lack real-time visibility into cycle completion rates and quality metrics, Help me track cycle status, completion percentages, and reading quality breakdowns by area, So that I can proactively identify and address issues before they impact billing schedules.
When I need to assign routes to appropriate meter readers, But I struggle to match reader availability, workload, and route requirements, Help me view reader workloads, ratings, and availability in a centralized interface, So that I can efficiently allocate resources and optimize route coverage.
When I need to identify performance issues in specific routes or with specific readers, But I don't have detailed metrics on reading accuracy and completion rates, Help me access granular performance data on route completion, reading quality, and turnaround times, So that I can implement targeted improvements and training where needed.
When I need to manage route assignments and reassignments quickly, But I lack a streamlined interface for these operations, Help me efficiently assign, unassign, and track route status changes, So that I can maintain operational flexibility and respond to changing field conditions.
When I need to understand quality issues affecting reading cycles, But I can't easily identify patterns in faulty or could-not-read situations, Help me visualize quality metrics with detailed breakdowns by route and reader, So that I can address systematic problems and improve overall reading quality.
4. Solution
The Utility Meter Compass Photo Meter Reading Management System provides a comprehensive solution for tracking, assigning, and monitoring photo meter reading operations, with the following key capabilities:
1. Read Cycle Management
- Creation and configuration of read cycles with clear timeline definitions
- Service area organization with route grouping and scheduling
- Cycle status tracking from creation through completion
- Performance metrics and historical comparison for cycle efficiency
2. Route Assignment and Dispatch
- Batch and individual route dispatch capabilities
- Route reassignment and unassignment functionality
- Clear visibility of route status and reader allocation
3. Reader Management
- Reader profile management with workload tracking
4. Performance Monitoring
- Real-time completion rate tracking by cycle and route
- Reading quality metrics (normal, faulty, could-not-read)
- Turnaround time measurement and trending
- Photo submission tracking and quality assessment
5. Route Details and Navigation
- Detailed view of meters, consumers, and premises by route
- Completion status tracking at the route level
- Due date and priority indicators
- Problem flagging and resolution tracking
6. Quality Control
- Reading quality classification (normal, faulty, RCNT)
- Problem reporting and categorization
- Photo verification and validation tools
- Exception management and resolution tracking
7. Reporting and Analytics
- Cycle performance dashboards with key metrics
- Route completion status reports
- Reader performance analysis
- Quality metrics trending and comparison
- Exportable reports for management review
5. Major Steps Involved
For Meter Reading Supervisor:
Monitoring Read Cycles
- Log into the Smart 360 system
- Navigate to the "Photo Meter Reads" section from the left navigation panel
- View the dashboard showing cycles by status (Not Dispatched, Dispatched, In Progress, Completed)
- Filter cycles by month, status, or sort by run date as needed
- Review the read cycle list with key metrics (meters, consumers, readings, quality breakdown, completion %)
- Click on a specific cycle (e.g., "Downtown Area Q2") to view detailed information
Viewing Cycle Details
- On the cycle details page, review the cycle information section (name, type, date range, meters, consumers)
- Check performance metrics (completion rate, reading accuracy, avg. turnaround, photo submission)
- Analyze meter reading quality breakdown (normal, faulty, RCNT percentages)
- Review route completion status for all routes in the cycle
- Identify problematic routes with low completion rates or quality issues
- Toggle between "Details" and "Dispatch" tabs to manage route assignments
Assigning Routes
Reassigning/Unassigning Routes
Analyzing Performance Metrics
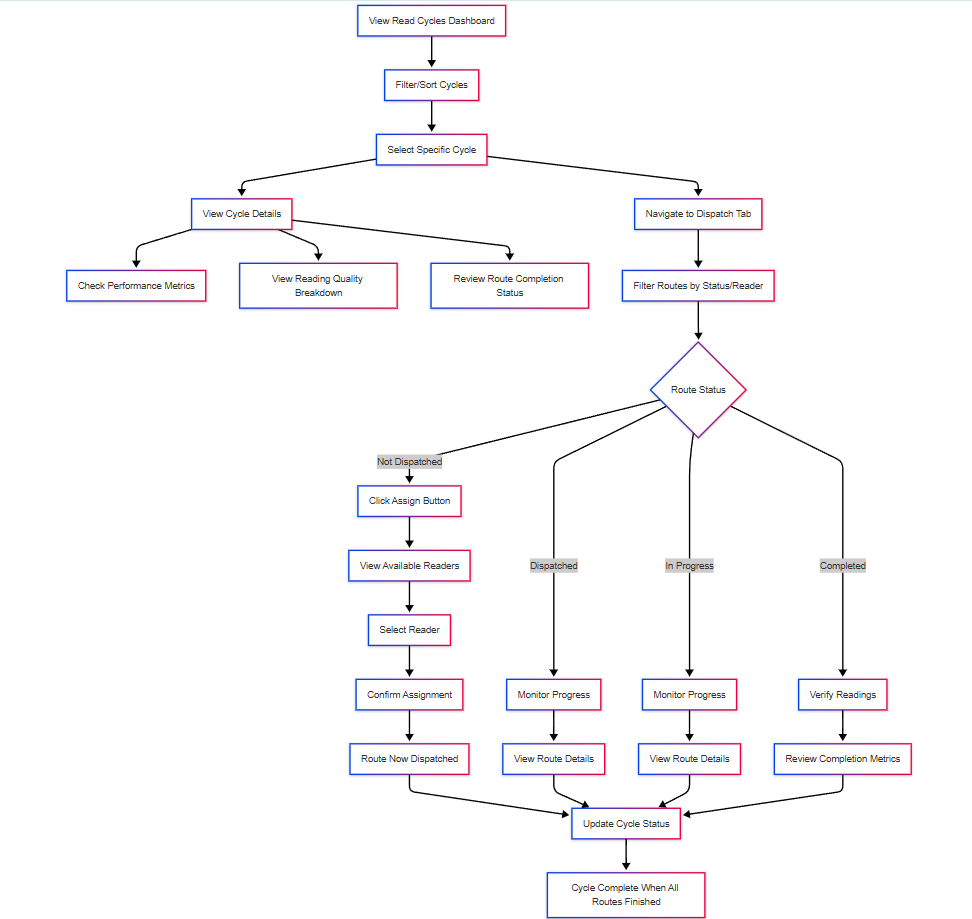
6. Flow Diagram
7. Business Rules
General Rules
- All meter reading cycles must have a defined date range with clear start and end dates
- Each route must be assigned to a meter reader before readings can begin
- Routes cannot be assigned to unavailable readers
- A meter reader's workload should not exceed their capacity (based on currently assigned routes)
- All reading problems must be categorized as either Faulty or Could Not Read (RCNT)
- Cycle completion percentage is calculated based on the total number of readings completed divided by total meters in the cycle
- Reading accuracy is calculated based on the percentage of normal readings out of total readings
- Routes with 0% completion after their due date must be flagged for supervisor attention
- Routes cannot be marked as completed unless all meters have readings or documented exceptions
Dispatch Rules
- Only routes with "Not Dispatched" status can be assigned to readers
- Routes can be unassigned only if they are in "Dispatched" or "In Progress" status
- Unassigning a route changes its status to "Not Dispatched"
- Assigning a route changes its status to "Dispatched"
- A reader cannot be assigned more than their maximum route capacity
- Routes with "Problem" status can be reassigned to different readers after issue review
Status Transition Rules
- Route status must follow the sequence: Not Dispatched → Dispatched → In Progress → Completed
- Routes can be marked as "Problem" from "In Progress" status
- Routes cannot transition from "Completed" to any other status without supervisor override
- Read cycles are automatically marked "In Progress" when at least one route is in progress
- Read cycles are automatically marked "Completed" when all routes are completed
Reading Quality Rules
- Readings must be classified as Normal, Faulty, or Could Not Read (RCNT)
- Faulty readings require photo documentation and issue description
- RCNT readings require categorization of the reason (access issue, meter problem, etc.)
- Routes with more than 25% faulty or RCNT readings require supervisor review
- Readers with consistently high faulty/RCNT percentages across routes should be flagged for additional training
List View Page
1. Top Summary Tiles (Counters)
Field | Business Rule |
|---|---|
Not Dispatched | Count of read cycles where status in this current month = "Not Dispatched" |
Dispatched | Count of read cycles where status in this current month= "Dispatched" |
In Progress | Count of read cycles where status in this current month = "In Progress" |
Completed | Count of read cycles where status in this current month = "Completed" |
2. Filters
Field | Business Rule |
Search | Performs a case-insensitive match on read cycle name. |
Month | Filters records by |
Status | Filters based on the current |
Sort By | Sorts based on selected criteria: |
3. Read Cycle Fields
Field | Business Rule |
Read Cycle Name | Name of the Read Cycle |
Month | Represents the scheduled month of the read cycle (format: From Onboarding). |
Meters | Count of meters assigned to this read cycle. |
Consumers | Count of unique consumers linked to the assigned meters. |
Readings | Count of meters for which photo-based readings have already been submitted. |
4. Meter Quality Breakdown
Field | Business Rule |
Normal | Count of meters marked with no known issues during previous validation. |
Faulty | Count of meters flagged as faulty (due to damage, reading failure, etc.). |
RCNT | Count of recently connected meters (RCNT = Recently Connected), typically new installations. |
5. Completion %
Field | Business Rule |
Completion % | (Number of Readings / Total Meters) * 100. Rounded to nearest whole number. Progress bar fills accordingly. |
6. Status
Status | Business Rule |
Not Dispatched | No dispatch has occurred for the cycle for the active cycles of the current month |
Dispatched | Cycle has been dispatched, but no readings are recorded yet. |
In Progress | At least one reading has been submitted but the cycle isn’t complete. |
Completed | All meters have submitted readings. |
7. Run Dates
Field | Business Rule |
Last Run Date | Recent date on which the cycle was run |
Next Run Date | Scheduled next run. If the schedule end date is reached, it is “N/A.” |
8. Actions
Button | Business Rule |
View | Opens the detailed cycle view page. |
Dispatch | Triggers the dispatch workflow. Disabled if cycle is already marked as "Completed". On click navigate user to Dispatch tab |
View Details Page
On top of the page there is a searchable dropdown beside the cycle name where user can search for read cycle he want to view and select to view cycle details and dispatch details of the cycle the dropdown should only consist of active cycles active cycles are those with status not dispatched, dispatched and inprogres.
1. Cycle Information
| Field | Description | Business Rule |
|---|---|---|
Cycle Name | Name of the meter reading cycle | Name of the meter cycle created by user |
Read Type | Type of read (Photo Read, Manual) | Set at cycle creation; cannot be changed mid-cycle |
Month/Period | Month the read is scheduled for | Month of the cycle run/ year |
Status | Indicates progress of the cycle | Not Dispatched status will stay until all the routes are dispatched, Dispatched status will stay when all the routes are dispatched and will update to in progress when meter readers start uploading meter readings |
Date Range | Start and end dates of the read cycle | Derived from Date Range; start date as the date the cycle is run end date will be start date + cycle duration |
Number of Routes | Total unique routes under this cycle | Calculated from route assignment mapping |
Number of Meters | Total meters mapped in the cycle | Fetched from meter-to-route mapping |
Number of Consumers | Total consumers impacted | Derived from unique consumer IDs linked to meters |
2. Cycle Metrics
Metric | Description | Business Rule |
Completion Rate | % of meters with completed reading |
|
Reading Accuracy | % of readings marked |
|
Avg. Turnaround | Avg. time between reading assigned vs uploaded |
|
Photo Submission | % of meters with valid photo proof |
|
3. Meter Reading Quality
Updated to 0 when the status changes to not dispatched until then metric of the previous run should be displayed and stays 0 until the status changes to in progress dynamically changes when the meter reader start uploading readings
Status | Definition |
Normal | Reading with normal status |
Faulty | Reading with faulty status |
RCNT | Reading with RCNT status |
4. Route Completion Status
Route | Completion % | Business Rule |
Route Name | Completion shown as % of meters read in route | Calculated: |
Note: All % changes compared to last cycle are calculated using:(Current Cycle Metric - Last Cycle Metric) ÷ Last Cycle Metric * 100
Color Codes:
- Green ↑ = Improvement
- Red ↓ = Decrease
- Neutral = No significant change
System automatically highlights best and worst performing routes.
Dispatch Tab
The Dispatch view includes:
- Filtering options at the top for Status, Meter Reader (Assigned, Unassigned), and Date Range (with Start Date and End Date fields) for Due Date
- A search bar labeled "Search by route name..."
- A data table showing meter reading routes with the following columns:
- Route Name: route names of all the routes selected while adding cycle
- Meters (total count)
- Consumers (count)
- Premises (count)
- Readings (completed/total)
- Assigned To (staff name), NA if route is not assigned
- Assigned Date: Date on which the route is assigned to the reader
- Due Date: Cycle Run Date + Cycle Duration
- Status: Not Dispatched, Dispatched, In Progress, Completed
- Actions: Assign if the route is of status Not Dispatched, Unassignd if the status is of status Dispatched, action buttons will be disabled once the status changes to in progress
- when click on assign button should open a modal where user can search for meter reader and view details in tabular format and the columns of the table should be ID, Name, Contact, Workload (Number of routes assigned to that meter reader which are either in Dispatched status or in progress status across all the active cycles)
- Unassign should open a dialogue box to take confirmation form user to unassign the route to the meter reader, once chosen confirm status of the route should be changed to not dispatched.
8. Sample Data
Read Cycles
Cycle Name | Month | Meters | Consumers | Readings | Normal | Faulty | RCNT | Completion % | Status |
|---|---|---|---|---|---|---|---|---|---|
Downtown Area Q2 | April 2025 | 145 | 128 | 89 | 72 | 12 | 5 | 61% | In Progress |
East Industrial Zone | April 2025 | 65 | 28 | 40 | 28 | 10 | 2 | 62% | Problem Reported |
North Residential | April 2025 | 230 | 212 | 0 | 0 | 0 | 0 | 0% | Not Dispatched |
South Residential | April 2025 | 320 | 290 | 250 | 220 | 25 | 5 | 78% | Dispatched |
Commercial District | March 2025 | 78 | 45 | 78 | 65 | 8 | 5 | 100% | Completed |
Routes
Route Name | Meters | Consumers | Premises | Readings | Assigned To | Assigned Date | Due Date | Status |
|---|---|---|---|---|---|---|---|---|
Downtown Route 1 | 28 | 25 | 20 | 28/28 | John Smith | Mar 10, 2025 | Apr 10, 2025 | Completed |
Downtown Route 2 | 32 | 30 | 25 | 25/32 | Emma Johnson | Mar 12, 2025 | Apr 12, 2025 | In Progress |
Downtown Route 3 | 24 | 22 | 18 | 18/24 | Michael Davis | Mar 15, 2025 | Apr 15, 2025 | In Progress |
Downtown Route 4 | 19 | 15 | 12 | 15/19 | Sarah Wilson | Mar 18, 2025 | Apr 18, 2025 | Problem |
Downtown Route 5 | 22 | 18 | 15 | 3/22 | Robert Brown | Mar 20, 2025 | Apr 20, 2025 | Dispatched |
Downtown Route 6 | 20 | 18 | 15 | 0/20 | NA | NA | Apr 25, 2025 | Not Dispatched |
Meter Readers
User ID | Name | Contact | Workload | Availability |
|---|---|---|---|---|
1 | John Smith | john.smith@example.com | 5 routes | Available |
2 | Emma Johnson | emma.j@example.com | 3 routes | Available |
3 | Michael Davis | m.davis@example.com | 7 routes | Available |
4 | Sarah Wilson | s.wilson@example.com | 4 routes | Unavailable |
5 | Robert Brown | r.brown@example.com | 2 routes | Available |
Performance Metrics
Metric | Downtown Area Q2 | Comparison to Last Cycle |
|---|---|---|
Completion Rate | 61% | +2.5% increase |
Reading Accuracy | 93.5% | +1.2% increase |
Avg. Turnaround | 3.2 days | -0.5% decrease |
Photo Submission | 72.8% | +4.8% increase |
9. Acceptance Criteria
- The system must display read cycles with clear status indicators (Not Dispatched, Dispatched, In Progress, Completed)
- The system must provide filtering capabilities for read cycles by month, status, and sort order
- The system must display key metrics for each read cycle including meters, consumers, readings, and completion percentage
- The system must categorize reading quality into Normal, Faulty, and RCNT with counts and percentages
- The system must provide a detailed view of each read cycle with performance metrics and route status
- The system must calculate and display completion rate, reading accuracy, average turnaround, and photo submission metrics
- The system must show historical comparisons for key metrics against previous cycles
- The system must provide route completion status for all routes within a cycle with percentage indicators
- The system must support filtering routes by status, meter reader, and date range
- The system must allow assignment of routes to available meter readers with workload visibility
- The system must prevent assignment of routes to unavailable meter readers
- The system must allow unassignment of routes with appropriate status changes and confirmations
- The system must display detailed route information including meters, consumers, premises, and reading counts
- The system must clearly indicate route status with color-coded labels (Completed, In Progress, Problem, Dispatched, Not Dispatched)
- The system must track assigned dates and due dates for all routes
- The system must allow searching routes by name within cycles
- The system must provide actions appropriate to route status (Assign, Unassign)
- The system must require confirmation before unassigning routes from meter readers
- The system must display meter reader workload to prevent overallocation
- The system must automatically update cycle status based on the status of component routes
10. Process Changes
Current Process | New Process | Impact |
|---|---|---|
From: Manual tracking of read cycle status using spreadsheets | To: Automated real-time status tracking with visual indicators | Reduces administrative time by 70% and provides immediate visibility into cycle progress |
From: Ad-hoc assignment of routes to readers with limited visibility into workloads | To: Data-driven route assignment with reader workload, rating, and availability information | Improves resource utilization by 25% and ensures balanced workload distribution |
From: Limited visibility into reading quality issues and problems | To: Detailed breakdown of reading quality with Normal, Faulty, and RCNT classifications | Enables targeted quality improvement initiatives, potentially reducing exception rates by 30% |
From: Manual performance tracking requiring compilation of multiple data sources | To: Automated performance metrics with historical comparisons | Saves 5-8 hours per week in reporting time and provides actionable insights for improvement |
From: Reactive problem management after billing issues occur | To: Proactive identification of routes with problems or low completion rates | Reduces billing errors by 40% by addressing reading issues before bill generation |
From: Siloed information with limited visibility between field operations and supervisors | To: Shared platform with real-time updates and status changes | Improves cross-functional coordination and reduces communication delays by 60% |
From: Manual reassignment process when readers are unavailable | To: Streamlined unassignment and reassignment workflow with status tracking | Reduces route coverage gaps by 50% and ensures timely completion of critical routes |
From: Limited ability to prioritize routes based on due dates and status | To: Clear visibility of due dates and completion status for prioritization | Improves on-time completion rates by 35% by focusing resources on highest priority routes |
11. Impact from Solving This Problem
Metric | Impact |
|---|---|
Billing Cycle Time | Reduces billing cycle time by 2-3 days by improving the efficiency and timeliness of meter reading completion |
Reading Accuracy | Improves reading accuracy by 5-10% through better quality control and problem identification |
Resource Utilization | Optimizes meter reader utilization by 20-30% through better workload balancing and assignment |
Exception Handling Time | Reduces time spent resolving reading exceptions by 40-50% through earlier identification and categorization |
Operational Visibility | Provides 100% visibility into cycle and route status compared to previous limited visibility |
Customer Billing Complaints | Reduces billing-related customer complaints by 15-25% through improved reading accuracy |
Regulatory Compliance | Improves compliance with regulatory reading schedules by 30-40% through better tracking and prioritization |
Employee Satisfaction | Increases field staff satisfaction by providing clear workload expectations and performance feedback |
Management Reporting Time | Reduces time spent compiling management reports by 70-80% through automated metrics and dashboards |
Cost of Reading Operations | Reduces overall operational costs by 10-15% through improved efficiency and reduced rework |
12. User Behavior Tracking
Meter Reading Supervisor
Event | Properties | Insights |
|---|---|---|
Cycle View | Cycle ID, Filter Applied, Sort Order, Time Spent | Understanding which cycles require most supervisor attention |
Route Assignment | Route ID, Reader ID, Assignment Time, Previous Assignment Status | Tracking assignment patterns and workload distribution strategies |
Route Unassignment | Route ID, Reader ID, Reason, Route Completion % | Identifying problematic routes or reader performance issues |
Cycle Detail View | Cycle ID, Tab Selected (Details/Dispatch), Time Spent, Metrics Viewed | Determining which performance metrics drive supervisor decisions |
Filter Application | Filter Type (Status/Reader/Date), Values Selected, Result Count | Understanding supervisor workflow and prioritization patterns |
Assignment Modal View | Search Terms Used, Readers Viewed, Selection Time | Analyzing decision-making process for route assignments |
Refresh Action | Page Location, Previous Action, Time Since Last Refresh | Monitoring frequency of status checking and workflow patterns |
Cycle Switching | Previous Cycle ID, New Cycle ID, Time Spent on Previous | Understanding prioritization and attention distribution across cycles |
Sort Action | Column Sorted, Direction, Page Location | Identifying key metrics used for decision making |
Problem Review | Route ID, Problem Status, Time Spent Reviewing | Tracking focus on problem resolution |
Questions Answered:
- Which cycles require the most supervisor attention and time?
- Are routes being optimally assigned to readers based on workload, rating, and availability?
- What assignment patterns produce the best completion rates and quality metrics?
- How frequently does the supervisor check for status updates and in what contexts?
- How much time is spent on assignment activities versus performance monitoring?
- Are there patterns in route reassignments that indicate systematic issues?
- Which performance metrics most heavily influence supervisor decisions?
- How does the supervisor prioritize attention across multiple cycles and routes?
- What filtering and sorting patterns indicate supervisor workflow preferences?
- How much time is spent addressing problematic routes versus routine management?
No Comments