Enhancements
Meter Device Summary Dashboard (MX01US01)
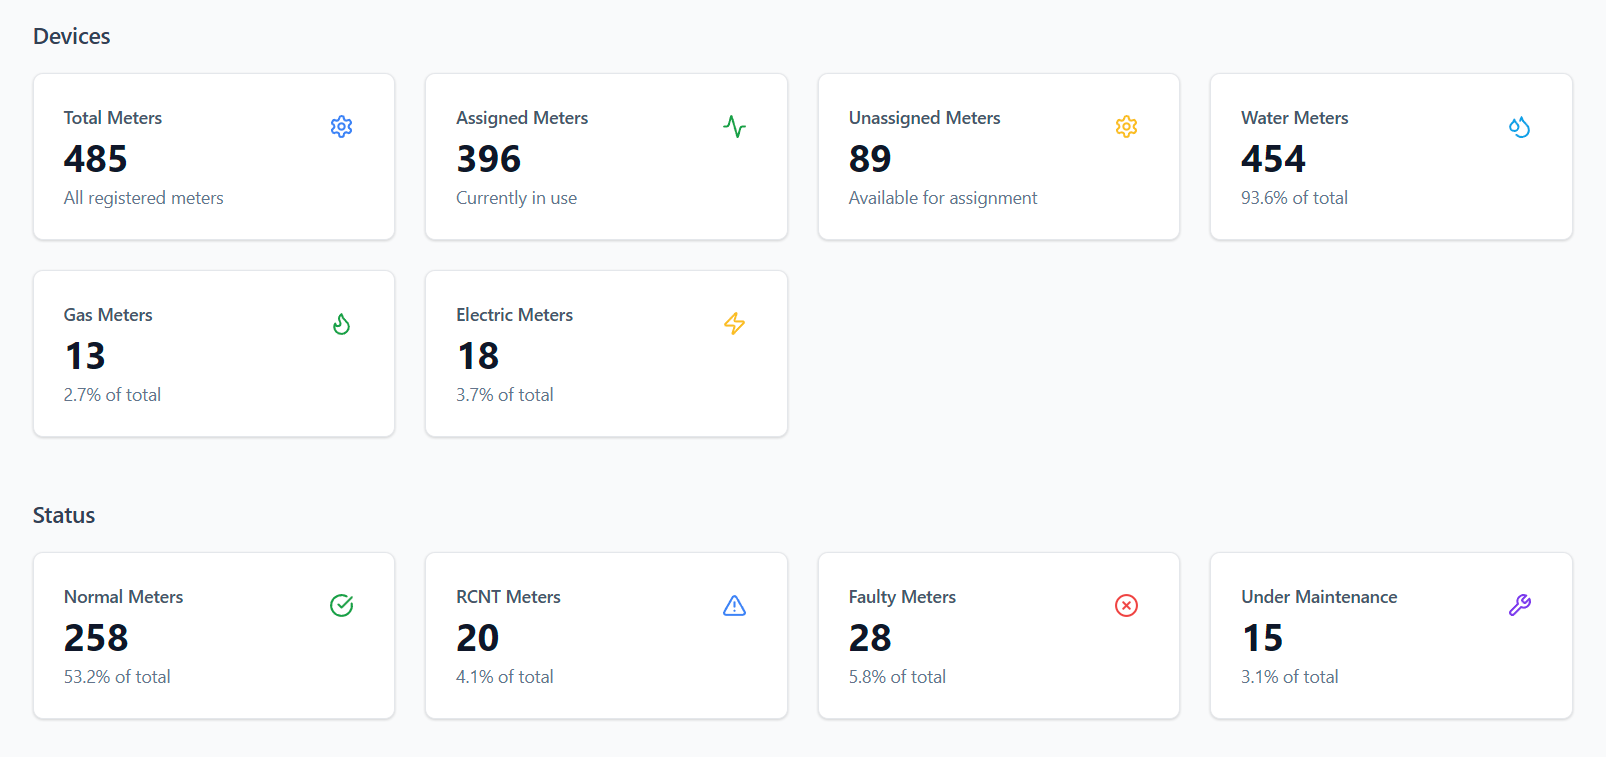
Section 1: Devices
1.1 Total Meters
- Definition: Count of all meters registered in the system
- Calculation: Sum of all meters regardless of type or status
- Display: Absolute number only
- Source: Master meter registry
1.2 Assigned Meters
- Definition: Meters currently deployed and in active use
- Calculation: Count of meters with active assignments to customers/locations
- Display: Absolute number with descriptive text "Currently in use"
- Business Logic: A meter is considered "assigned" when it has an active customer account association
1.3 Unassigned Meters
- Definition: Meters that are in both unassigned state and in inventory
- Calculation: Total Meters - Assigned Meters
- Display: Absolute number with descriptive text "Available for assignment"
- Business Logic: Includes new meters, returned meters, and meters removed from service but still functional
1.4 Meter Type Breakdown (Water/Electric/Gas)
- Definition: Count and percentage distribution of meters by utility type
- Calculation:
- Count by meter type classification
- Percentage = (Type Count / Total Meters) × 100
- Display: Absolute number + percentage of total
- Validation: Sum of all meter types must equal Total Meters
Section 2: Status
2.1 Normal Meters
- Definition: Meters functioning properly with no issues and reading status as normal
- Calculation: Count of meters with status = "Normal" or "Operational"
- Display: Absolute number + percentage of total
- Business Logic: Default status for newly installed and properly functioning meters
2.2 RCNT Meters (Requiring Attention)
- Definition: Meters flagged for review or requiring immediate attention with reading status as RCNT
- Calculation: Count of meters with status = "RCNT" or similar alert status
- Display: Absolute number + percentage of total
- Business Logic: Includes meters with reading anomalies, communication issues, or pending inspections
2.3 Faulty Meters
- Definition: Meters confirmed as malfunctioning or broken with reading status Faulty
- Calculation: Count of meters with status = "Faulty" or "Defective"
- Display: Absolute number + percentage of total
- Business Logic: Meters requiring repair or replacement, not providing accurate readings
2.4 Under Maintenance
- Definition: Meters currently being serviced, repaired, or upgraded
- Calculation: Count of meters with status = "Under Maintenance" or "In Service"
- Display: Absolute number + percentage of total
- Business Logic: Temporary status during scheduled maintenance, repairs, or upgrades
Meter Reading Validation Dashboard (MX00US01)
1. Universal Timeline Filters
1.1 Universal Month Filter
- Location: Top-most position on dashboard, left-aligned
- Data Source: Available months from meter reading history
- Options: Display format "Month YYYY" (e.g., "August 2025", "July 2025")
- Default Selection: Current month or most recent month with data
- Behavior:
- On selection, automatically refresh all dashboard data
- Trigger loading states across all widgets
- Update read cycle filter options based on available cycles for selected month
1.2 Read Cycle Filter
- Location: Adjacent to month filter, horizontally aligned
- Data Source: Available read cycles for the selected month
- Options: "Cycle 1", "Cycle 2", "Cycle 3", "Cycle 4"
- Default Selection: Most recent completed cycle or current active cycle
- Dependencies: Options dynamically populate based on month selection
- Behavior:
- Only show cycles that have data for the selected month
- Disable cycles that are scheduled but not yet executed
- Update all dashboard metrics when selection changes
1.3 Reset Filters
1.4 Loading States
- Duration: Show loading indicators for minimum 500ms, maximum 5 seconds
- Scope: Apply to all cards, charts, and tables simultaneously
- Visual: Skeleton loading or spinner overlay on each affected component
2. Card/Section Removal Rules
2.1 Validation Statistics Card
- Remove: Entire card showing "88% Overall Validation Rate"
- Data Retention: Preserve underlying data for potential future use
- Dependencies: Remove any references or calculations dependent on this display
2.2 Read Cycle Validation Chart
- Remove: Bar chart displaying Cycle 1-4 data
- Data Impact: No impact on source data, only display removal
- Space Allocation: Reallocate space to remaining components
2.3 Daily Validation Trend Chart
- Remove: Line chart with 05/01-05/07 timeline
- Alternative: Data available through detailed reports if needed
3. Reading Quality Assessment Section
3.1 High Consumption Meters
- Definition: Meters with usage ≥ 80th percentile of consumption for the selected period
- Calculation: Calculate percentile based on all active meters in selected month/cycle
- Display: Count + percentage of total meters
- Color Code: Green (
#10B981) - Business Logic: Exclude meters with zero or negative readings from percentile calculation
3.2 Medium Consumption Meters
- Definition: Meters with usage between 20th-80th percentile
- Calculation: Middle 60% of consumption distribution
- Display: Count + percentage of total meters
- Color Code: Yellow/Orange (
#F59E0B) - Business Logic: Represents typical consumption patterns
3.3 Low Consumption Meters
- Definition: Meters with usage ≤ 20th percentile (but > 0)
- Calculation: Bottom 20% of non-zero consumption
- Display: Count + percentage of total meters
- Color Code: Red (
#EF4444) - Business Logic: May indicate leaks, conservation, or seasonal variation
3.4 Zero Usage Detected
- Definition: Meters with exactly 0 consumption reading
- Calculation: Count of meters where current reading = previous reading
- Display: Count only (percentage of total meters)
- Business Rule: Distinguish between true zero usage and no reading received
3.5 Negative Readings
- Definition: Meters showing negative consumption values
- Calculation: Count where current reading < previous reading
- Display: Count only
- Business Rule: Usually indicates meter malfunction or reading error
3.6 Estimated Readings
- Definition: Readings calculated by system rather than actual meter readings
- Calculation: Count of readings marked with estimation flag
- Display: Count + percentage of total readings
- Business Rule: Flag readings as estimated when meter communication fails
3.7 Consumption Distribution Chart
- Type: Horizontal bar chart or donut chart
- Data: Visual representation of High/Medium/Low consumption breakdown
- Colors: Match consumption level color coding
- Interactivity: Click to filter detailed views
4. Data Coverage & Time Period Display
4.1 Coverage Period Indicator
- Location: Prominent position below filters
- Format: "Data Period: [Start Date] - [End Date]"
- Example: "Data Period: August 1, 2025 - August 15, 2025"
- Business Rule: Show actual reading dates, not billing cycle dates
4.2 Last Data Refresh
- Format: "Last Updated: [Date] at [Time]"
- Update Trigger: Any new meter reading processed
- Display: Relative time for recent updates (e.g., "2 hours ago")
4.3 Data Completeness
- Calculation: (Meters with readings / Total expected readings) × 100
- Display: "Data Completeness: XX%"
- Threshold: Show warning if < 90% complete
4.4 Section Coverage Status
- Scope: Each major dashboard section
- Indicator: Small badge showing data availability
- States: "Complete", "Partial", "No Data"
5. Filter Consistency & Synchronization
5.1 Global Filter Application
- Scope: ALL dashboard components must respect filter selections
- Components Affected:
- Top metric cards
- Validation progress bar
- Meter conditions summary
- Recent validation issues table
- Reading quality assessment
Wireframe: Link
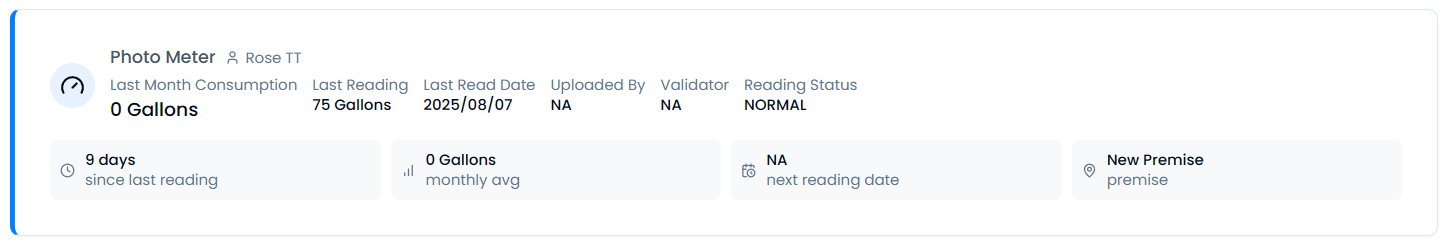
Device Management (MX01US02)
- In meter detailed view in the image mentioned below replace the photo meter with Meter Number and make the font a little big than the existing

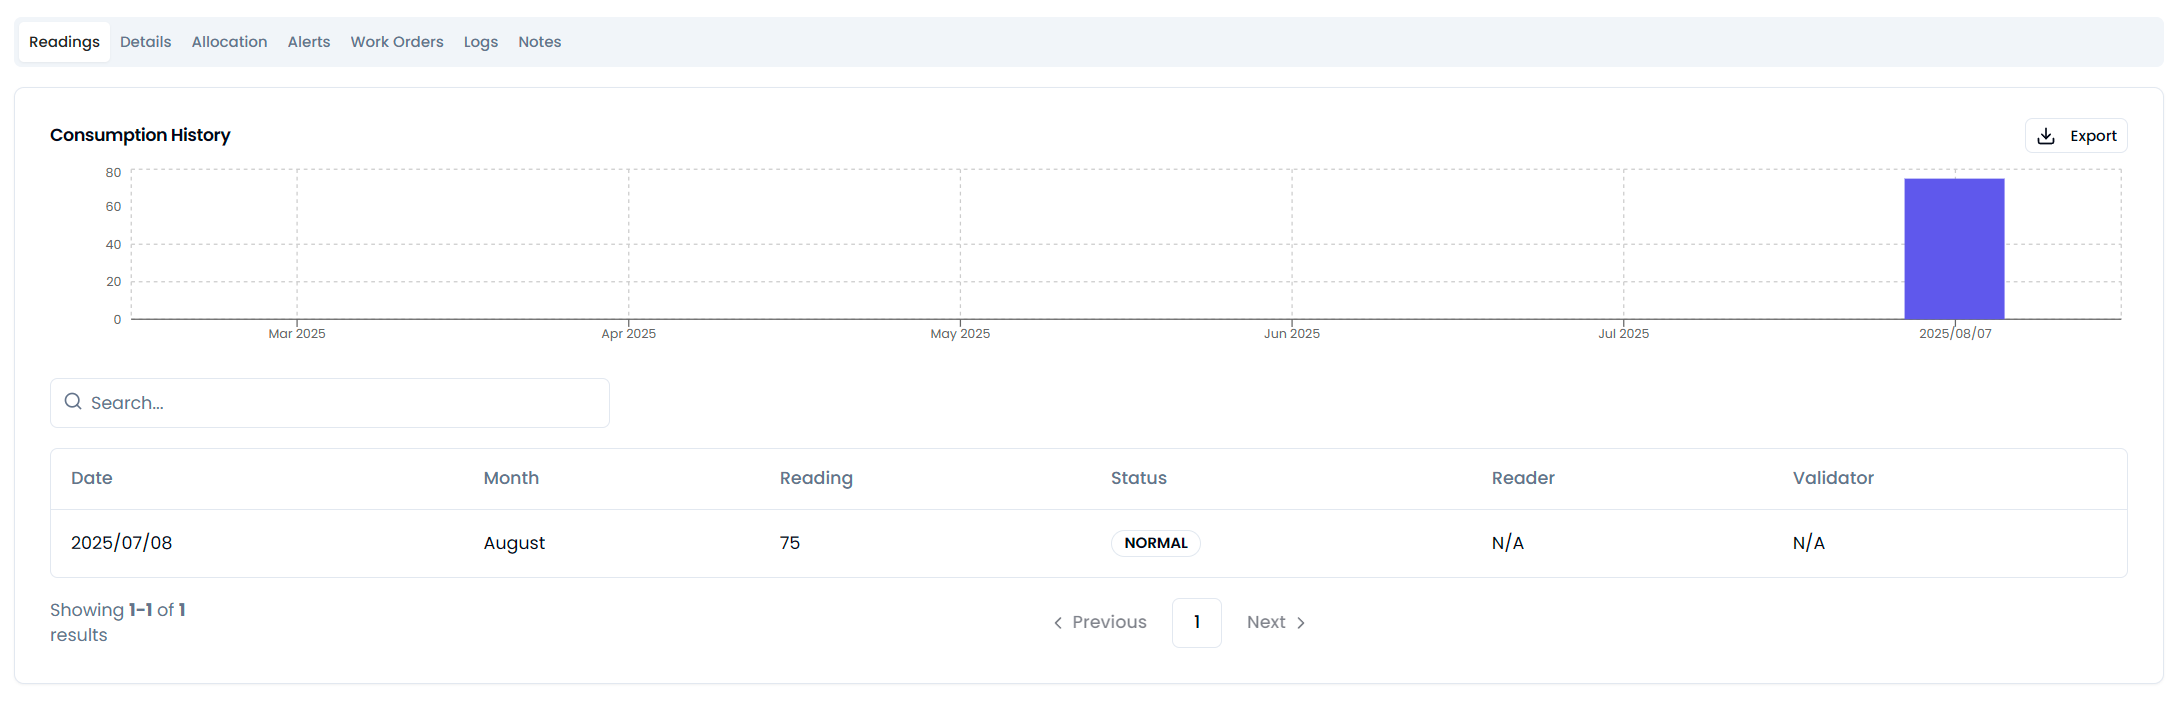
- in the readings tab in the consumption history graph also display the average consumption of the consumer category same as the consumer assigned to this meter
- add filter for the readings table provide years and date range in the filters

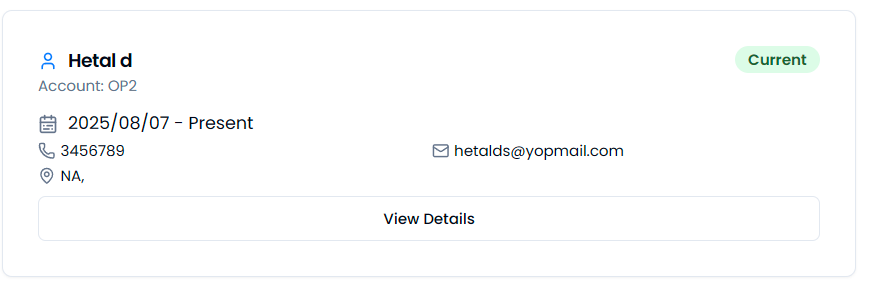
- In the allocations tab interchange the consumer name and account number places

- In the notes tab add created by information to the notes created
- Fix the tabs in detailed view and expand them to the width of the screen
Rout Management (MX02US01)
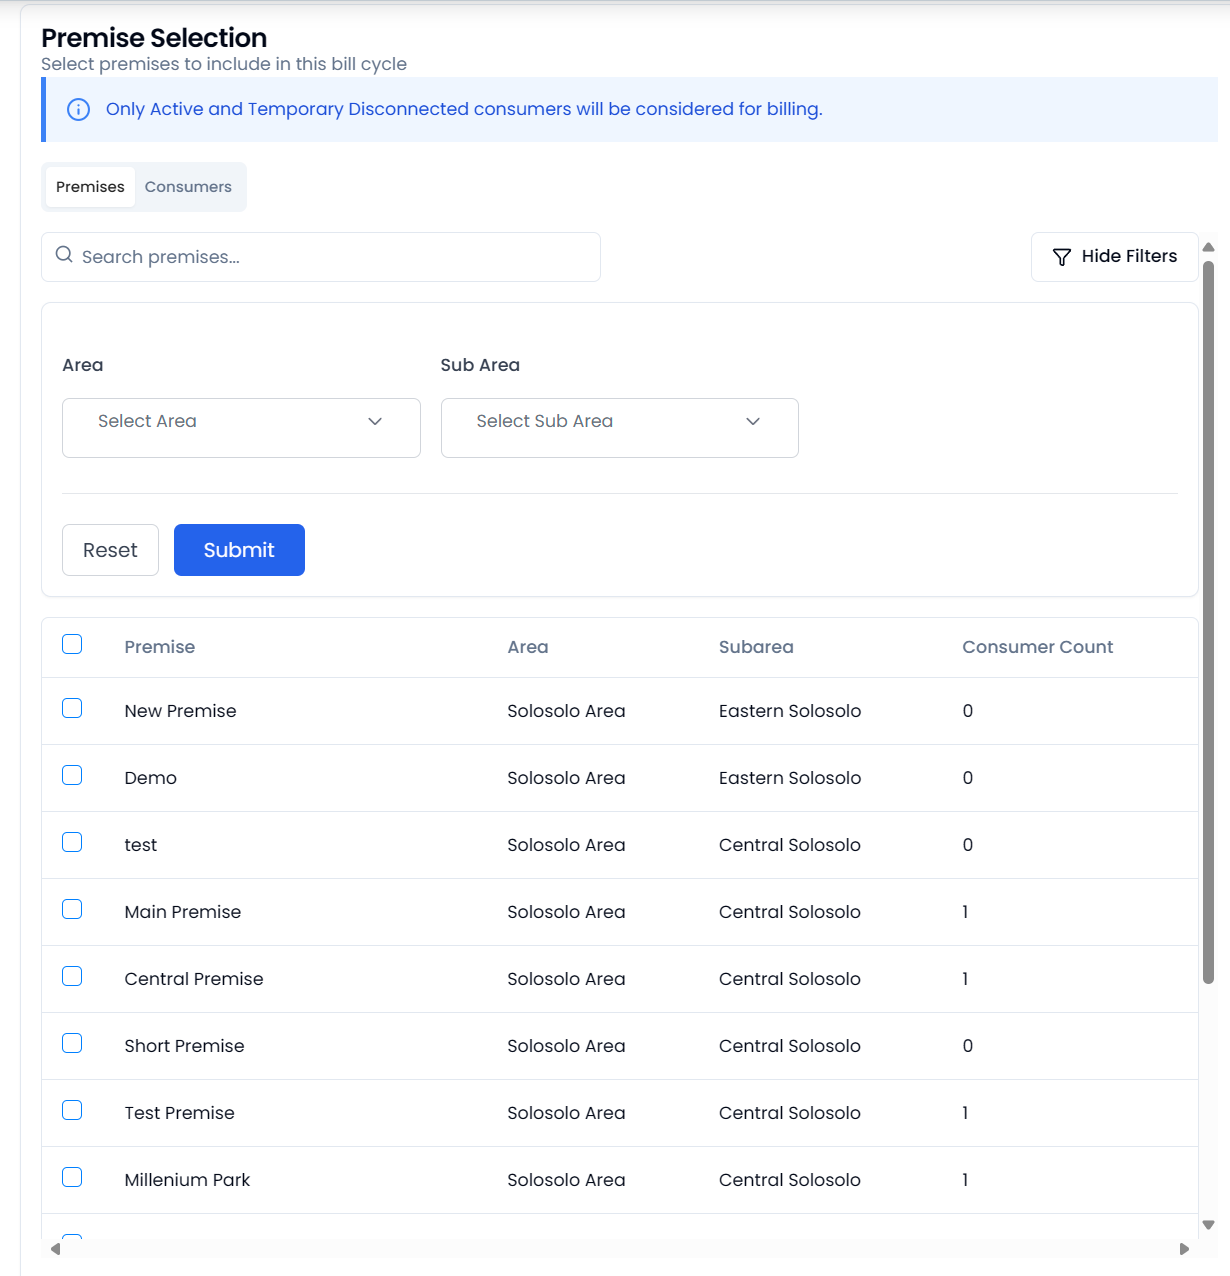
- In the add form of routes replace the area selection with the screenshot provided below no need to include premises and consumer tabs for reference refer bill cycle add form.

- Add 4 metric cards above the route table as mentioned below
- Total Routes: total number of routes created
- Consumer Coverage: Percentage of consumers covered in CX with the routes created
- Routes with Read Cycles: Routes that are added in a read cycle
- Routes without Read Cycles: Routes that are not added in any read cycle
- Remove Meter conditions metric card from add form of the route
Read Cycle Management (MX02US02)
- Add Total read cycles to the metrics cards above the list view of read cycles
- Add Utility Service in the filters of the read cycle list view
- Remove meter conditions form meter dashboard section in the add form of read cycle
- reduce pagination to 10 results in the route table of the add read cycle form
- once a read cycle is scheduled and when user opens it again user should be able to see the existing schedule details and make changes to the schedule to edit the existing one
Photo Meter Reads (MX02US03)
Need below mentioned fixes in the UI of the Photo Meter Reads Detailed View
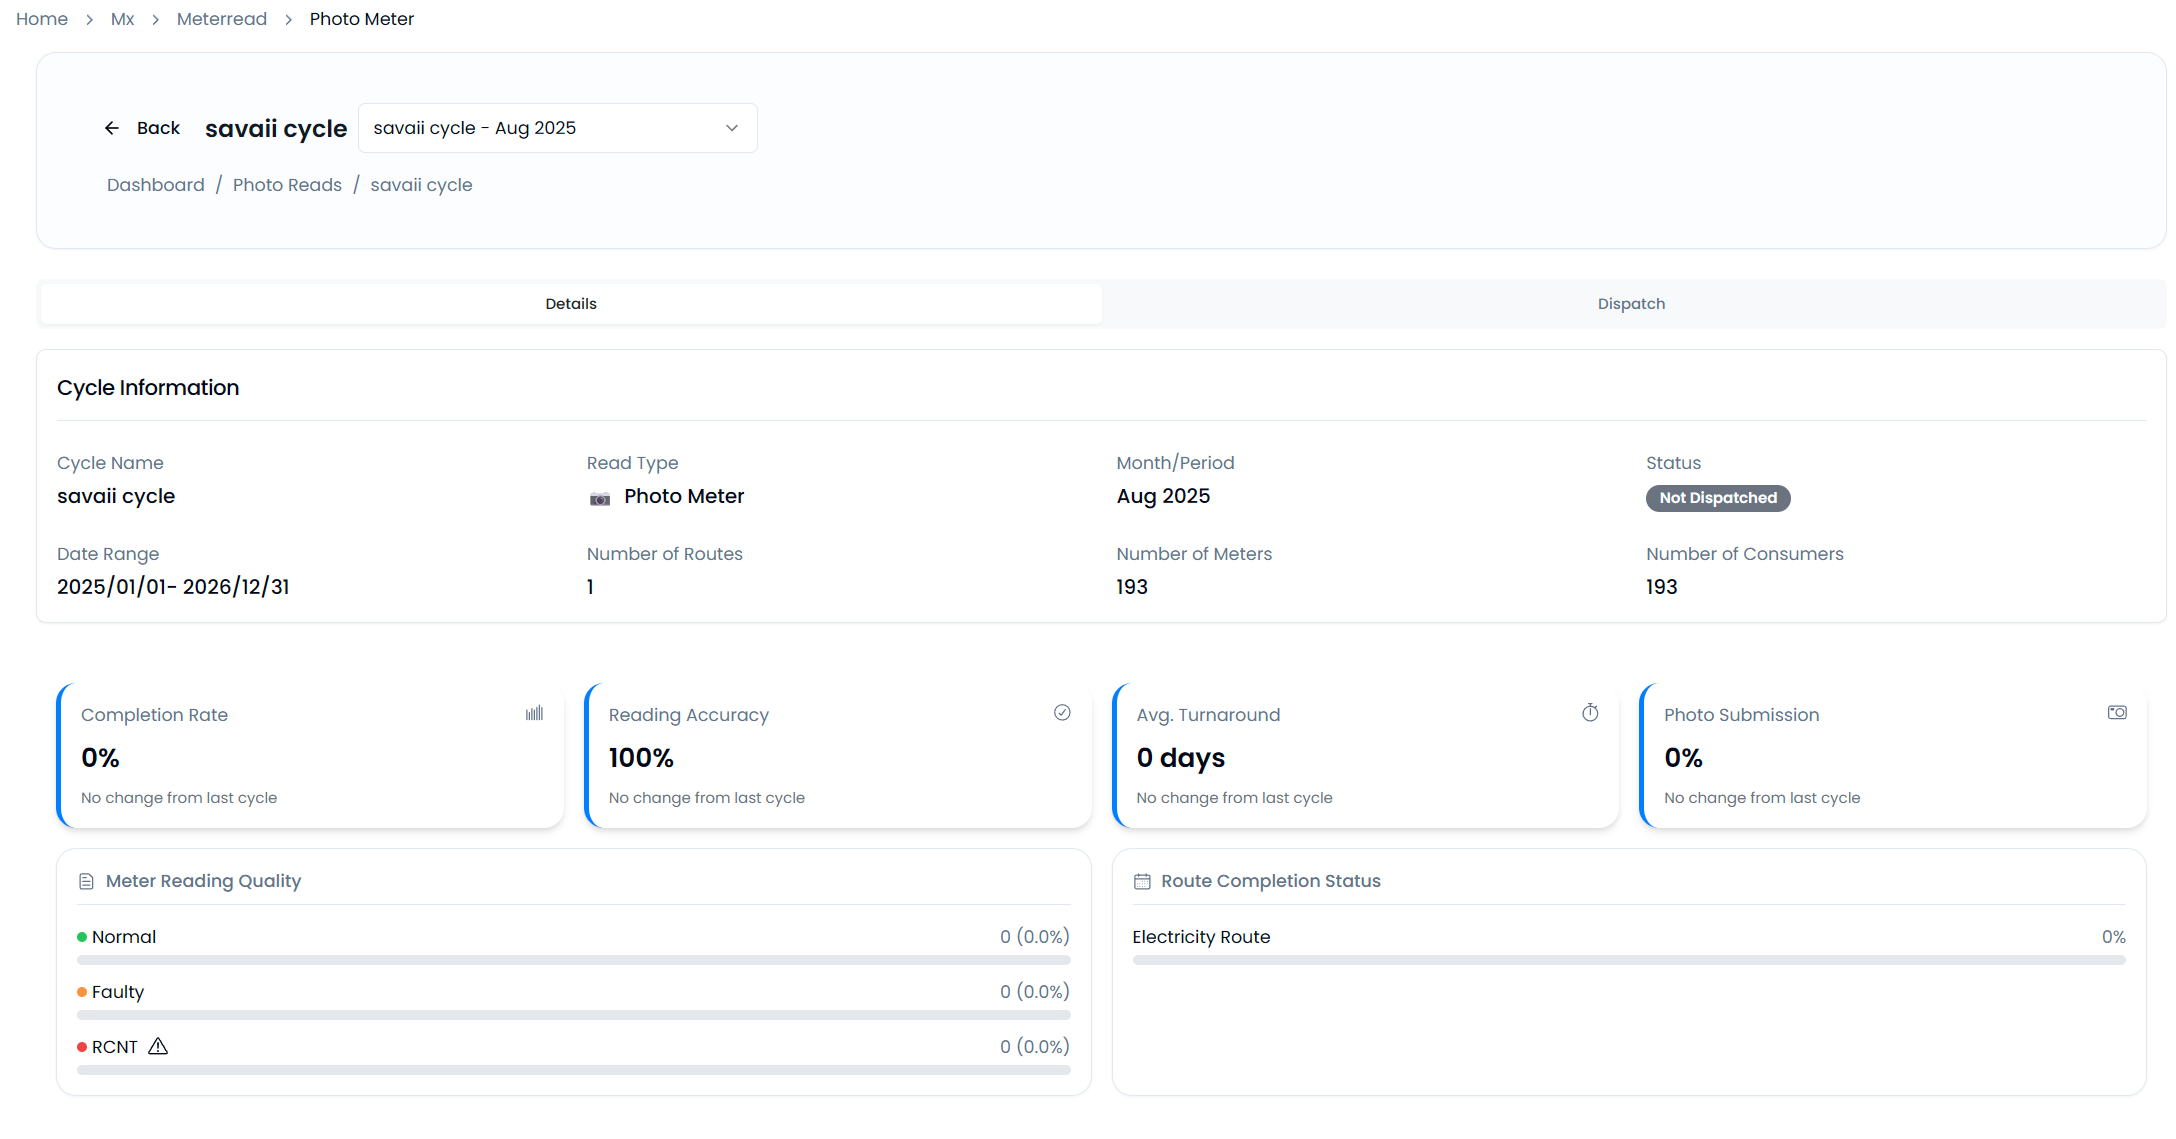
- Remove duplicate bread crumbs below the title of the read cycle
- move the cycle information card above the tabs
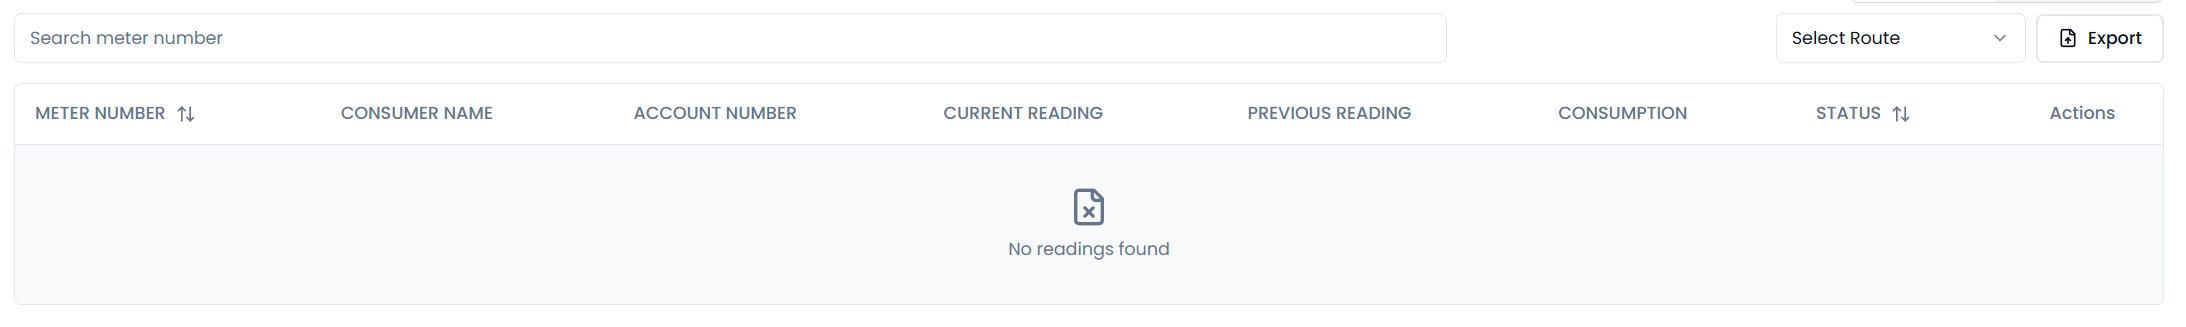
- in the detailed view add a tab called readings list and build the table as mentioned below for reference refer to the view readings tab in the validations

- Above the readings table add the below 4 metrics cards
- Include reading stats:
- Total meters: total no of meters in the read cycle
- Readings received today: Number of readings received today
- Pending days: number of days remaining to hit the due date calculated from the cycle duration
- High / Low / Zero consumption: three numbers displayed in the single card
Read Cycle List and Validations
- Add Filters and search for the cards list in the active cycles tab and make sure user should be able to filter by cycle, month and meter type
- Add days remaining beside the date range of in every card of the active read cycle
Validation Detail View
- Add Meter reader notes in the meter reader card, display the data that is send from the meter reader form from the mobile app..
- Wireframe - Link
- If the user clicks on the show previous image button, if there is no previous reading image available the display a error message "No previous reading available"
Add Meter
- In the Add meter form - there should be a checkbox below the device number - "Use device number as Meter number"
- If the box is check then the meter number will be same as device number. if the added device number is already present as a meter number then display error message - "meter number already exist".
No Comments