Reading Validation Dashboard (MX00US01)
Meter Reading Validation Dashboard - User Story
1. Problem Statement
Meter Manager
- Lacks a centralized view to monitor validation progress across all meter readings
- Struggles to quickly identify and address validation exceptions and issues
- Has difficulty tracking overall validation efficiency and performance metrics
- Cannot easily manage validation rules and configurations in one place
- Spends excessive time compiling reports from multiple sources to understand validation status
- Lacks real-time visibility into meter conditions and their impact on validation
Core Problem The Meter Manager lacks a comprehensive dashboard system for meter reading validation that provides real-time insights into validation progress, meter conditions, and exception management. This results in inefficient validation oversight, delayed issue resolution, and potential billing inaccuracies that affect both operational efficiency and customer satisfaction.
2. Who Is the User Facing the Problem?
Meter Manager
- Responsible for overseeing the entire meter reading and validation process
- Manages validation teams and ensures timely completion of validation cycles
- Tracks validation progress against billing deadlines
- Reports on validation efficiency and performance metrics to leadership
- Identifies and resolves validation bottlenecks
- Ensures meter reading data quality before it enters the billing system
- Coordinates with field teams for meter maintenance and verification
- Sets validation standards and operational targets
The Meter Manager needs access to the meter reading validation dashboard to effectively monitor, manage, and improve the validation process.
3. Jobs To Be Done
For Meter Manager:
- When I need to track the progress of the current reading cycle validation, But I lack a centralized view of validation status across all meters, Help me visualize validation metrics and progress in real-time, So that I can ensure timely completion of validation before billing cycles.
- When I need to identify problematic validation patterns, But I have to manually compile data from multiple sources, Help me access comprehensive validation statistics and trends, So that I can implement process improvements and reduce exception rates.
- When I need to manage validation resources effectively, But I don't have visibility into workload distribution, Help me monitor validation workload and staff performance, So that I can allocate resources efficiently and meet validation deadlines.
- When I need to review and address critical validation issues, But these issues are buried among routine exceptions, Help me identify and prioritize high-impact validation problems, So that I can resolve issues that would significantly impact billing accuracy.
- When I need to assess meter fleet health, But I can't easily see meter condition distributions, Help me visualize meter condition metrics alongside validation data, So that I can coordinate maintenance activities that improve reading quality.
- When I need to configure and optimize validation rules, But the current interface is fragmented and complex, Help me access and modify validation parameters through an intuitive interface, So that I can refine validation logic to improve automation rates.
4. Solution
The Meter Reading Validation Dashboard provides a comprehensive solution for the Meter Manager to monitor, manage, and optimize the meter reading validation process. The system delivers real-time visibility into validation status, streamlines exception handling, and provides powerful configuration tools.
Key Capability Areas:
- Validation Progress Monitoring
- Real-time validation status dashboard with key metrics (total meters, total reads, validated reads, pending validation, validation issues)
- Progress tracking against validation cycle timelines with visual completion percentage
- Detailed breakdown of validation categories (auto-corrected, manually verified, exceptions, field verification)
- Exception Management
- Prioritized list of validation issues requiring attention
- Categorization of issues by type and severity
- Quick access to detailed information for investigation
- Performance Analytics
- Validation efficiency metrics and trends over time
- Cycle-based validation statistics with comparative analysis
- Daily validation rate tracking with graphical visualization
- Meter Condition Monitoring
- Summary view of meter conditions across the system
- Distribution analysis of meter status categories (Normal, RCNT, Faulty, Missing)
- Correlation between meter condition and validation issues
- Validation Configuration Management
- Centralized access to validation rules, estimation rules, validator setup, and exemption codes
- Intuitive interfaces for rule modification and optimization
- Parameter adjustment tools to improve validation automation
- Search and Investigation Tools
- Advanced search capabilities by meter number or account
- Quick access to validation history and reading patterns
- Efficient issue investigation workflows
- Resource Optimization
- Validation workload distribution visibility
- Performance monitoring across validation team
- Resource allocation tools for balancing workload
- Reporting and Compliance
- Detailed validation reports for management and regulatory needs
- Historical performance tracking for continuous improvement
- Audit trails for validation decisions and rule changes
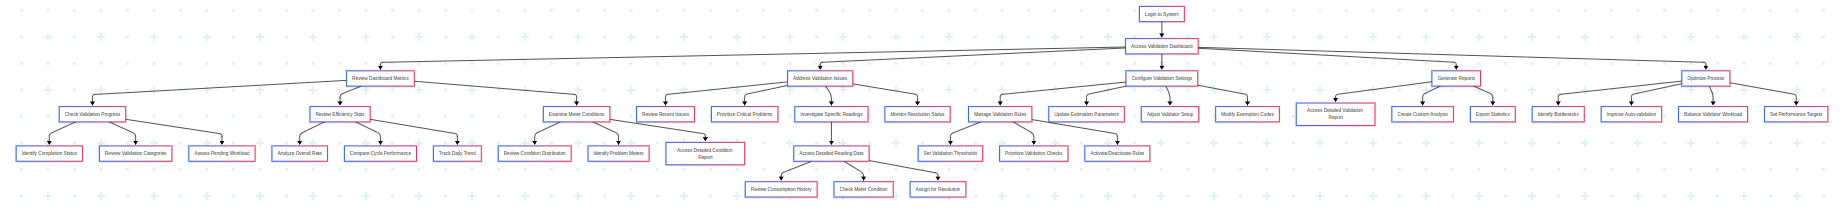
5. Major Steps Involved
For Meter Manager:
- Accessing the Dashboard
- Log into the SMART360 system using credentials
- Navigate to the Meter Reading module
- Select "Validation Dashboard" from the menu
- Reviewing Validation Progress
- View top-level validation metrics (Total Meters: 1,248, Total Reads: 945, Validated Reads: 721, Pending Validation: 165, Validation Issues: 59)
- Check the progress bar showing overall completion percentage (76% Complete)
- Review detailed breakdown of validation categories (Validated Reads: 721, Pending Review: 165, Auto-corrected: 42, Exceptions: 59, Exceptions Resolved: 32, Manually Verified: 47, Field Verification: 18)
- Analyzing Validation Efficiency
- Review the overall validation rate (88%)
- Compare current statistics (Total Readings: 1600, Validated Readings: 1400, Pending Validation: 200)
- Check today's validation rate (90.6%)
- View the Read Cycle Validation chart to compare performance across cycles
- Analyze the Daily Validation Trend graph to identify patterns and trends
- Examining Meter Conditions
- Navigate to the Meter Conditions Summary section
- Review distribution of meter conditions (Normal: 1240/77.5%, RCNT: 156/9.75%, Faulty: 120/7.5%, Missing: 84/5.25%)
- Analyze the relationship between meter conditions and validation issues
- Click "View Detailed Report" for in-depth analysis of meter conditions
- Addressing Validation Issues
- Review the Recent Validation Issues table showing problematic readings
- Examine specific issues (Consumption spike, Zero consumption, Reading below threshold, etc.)
- Prioritize critical issues based on customer type and issue severity
- Click the "View" action button for issues requiring further investigation
- Assign high-priority issues to specific validators when needed
- Monitor resolution status of assigned issues
- Click "View All Issues" to access the complete list of validation problems
- Configuring Validation Settings
- Use the search function to find specific meter reads if needed
- Navigate to configuration sections (Validation Rules, Estimation Rules, Validator Setup, Exemption Codes)
- Click "Configure" to modify validation rules and logic
- Adjust thresholds and parameters for exception flagging
- Click "Manage" to update estimation rules based on current patterns
- Configure validator assignments and workload distribution
- Update exemption codes and validation categories as needed
- Save changes and monitor impact on validation metrics
- Generating and Analyzing Reports
- Click "View Detailed Validation Report" to access comprehensive metrics
- Review historical performance data to identify trends
- Generate cycle-specific reports for management review
- Export validation statistics for further analysis
- Create custom reports for specific validation aspects
- Share performance insights with team and leadership
- Optimizing Validation Process
- Identify bottlenecks in the validation workflow
- Adjust validation rules to improve auto-validation rates
- Update validator assignments based on workload and expertise
- Implement process improvements based on performance data
- Document best practices for validation efficiency
- Set performance targets for next validation cycle
6. Flow Diagram
7. Business Rules
Validation Progress Monitoring
- Dashboard must display real-time validation status updated at minimum every on refresh.
- Validation completion percentage must be calculated as (Validated Reads / Total Reads) × 100.
- Progress metrics must be filterable by reading cycle.
Performance Metrics
- Validation efficiency metrics must be calculated daily, weekly, and by cycle.
- Overall validation rate must be calculated as (Validated Readings / Total Readings) × 100.
- Daily validation trend must track at least 7 consecutive days of performance.
Meter Condition Monitoring
- Meter conditions must be categorized as: Normal, RCNT (Recent), Faulty, or Missing.
- Condition percentages must be calculated against total meter count.
- Meters in Faulty condition must have validation issues automatically flagged.
- Meters in Missing condition must trigger investigation workflow.
- Meter condition reports must include trend analysis comparing current state to previous month.
Error Handling
- System must provide clear error messages for validation failures.
- Failed auto-validations must be automatically routed to manual queue.
- Data inconsistencies must trigger alert to Meter Manager.
- Validation rule conflicts must be identified during configuration.
- Repeated validation failures for same meter must trigger investigation alert.
Admin Dashboard Overview
Header Section
- Displays personalized greeting with administrator name ("Welcome, Admin")
- Shows current date and time (Tuesday, May 6, 2025 at 01:09 AM)
- Provides immediate context of system usage session
Key Metrics Cards
- Set of five cards displaying critical performance indicators:
- Total Meters: Total meters of all the active cycles (1,248)
- Total Reads: Number of readings collected in for all the active cycles (945)
- Validated Reads: Successfully verified readings (721 - 76% of total)
- Pending Validation: Readings awaiting verification (165 - 17% of total)
- Exemptions: Readings exempted by system validations (59 - 6% of total)
- Each card includes appropriate icon and percentage context
- Color-coded for quick status assessment
Current Reading Cycle Validations Section
- Shows detailed metrics for the active reading period
- read cycle selector with current period displayed
- Progress bar showing overall completion percentage (76% Complete)
- Total meter readings vs total validated readings
- Comprehensive breakdown of validation statistics:
- Total Readings: All readings collected in cycle (945)
- Validated Reads: Successfully verified readings (721)
- Pending Review: Readings awaiting verification (165)
- Estimated: Readings adjusted by system algorithms (42)
- Exceptions: Readings flagged with validation issues (59)
- Exceptions Resolved: Previously flagged readings now corrected (32)
- Adjusted: Readings adjusted by human validators (47)
- Revisit : Readings sent for revisit (18)
Validation Statistics Panel
- Shows overall validation rate as prominent percentage (88%)
- Provides broader context beyond current cycle:
- Total Readings: All readings of active read cycles (1600)
- Validated Readings: Successfully verified readings (1400)
- Pending Validation: Readings awaiting verification (200)
- Today's Validation Rate: Current day validation percentage (90.6%)
- Validated Readings / Total Readings * 100
Read Cycle Validation Chart
- Bar graph comparing validated vs. total readings across active cycles
- Green bars represent validated readings, purple bars show total readings
- Visualizes validation performance trends over time
Daily Validation Trend Chart
- Line graph showing day-by-day validation count
- Displays performance for previous seven days (05/01 - 05/07)
- Y-axis shows percentage scale number of validations per day
- Helps identify daily fluctuations and patterns
Meter Conditions Summary
- Tabular data showing meter status distribution:
- Normal: Meters operating correctly (1240 - 77.5%)
- RCNT: Readings requiring confirmation (156 - 9.75%)
- Faulty: Meters with operational issues (120 - 7.5%)
- Missing: Meters with no readings received (84 - 5.25%)
- Includes total count and link to detailed report
- Critical for monitoring meter health across the system
Meter Condition Distribution Chart
- Horizontal bar graph visualizing meter condition proportions
- Color-coded categories matching the summary table
- Provides immediate visual assessment of meter fleet status
Recent Validation Issues Section
- Table of problematic readings requiring attention
- Shows readings from the last 7 days with issues
- Columns include:
- Reading ID: Unique identifier for reading record (RD-####)
- Meter ID: Device identifier (MTR-####)
- Customer: Account name (commercial customers shown)
- Issue: Validation name that failed that particular reading
- Date: When the issue was detected
- Action: View button to examine details
- Navigate user to detailed view of the reading
- Includes link to view all issues
- Critical for prioritizing validation work
Search Meter Reads Section
- Search functionality for finding specific reading records
- Radio button selection of search criteria:
- Meter No: Search by device identifier (selected)
- Account No: Search by customer account
- Input field with placeholder text and search button
- Enables quick access to individual readings
- Result table should consist of Meter Number, device Numer, Account No, Consumer Name, Last Reding/ Date, Current Reading/ Date, Action (View)
- View should navigate user to the detailed view of the meter
Configuration Shortcuts
- Set of four cards for accessing system setup functions:
- Validation Rules: Configure validation algorithms and thresholds
- Estimation Rules: Define methods for estimating missing readings
- Validator Setup: Assign personnel to reading cycles
- Exemption Codes: Manage special case handling
- Each card includes descriptive text and action button
- Provides convenient access to administrative functions
8. Sample Data
Validation Dashboard Metrics
- Total Meters: 1,248 (System-wide count)
- Total Reads: 945 (Current read cycle)
- Validated Reads: 721 (76% of total reads)
- Pending Validation: 165 (17% of total reads)
- Validation Issues: 59 (6% of total reads)
- Progress: 76% Complete
- Auto-corrected: 42
- Manually Verified: 47
- Exceptions: 59
- Exceptions Resolved: 32
- Field Verification: 18
Validation Efficiency Metrics
- Overall Validation Rate: 88%
- Total Readings: 1,600
- Validated Readings: 1,400
- Pending Validation: 200
- Today's Validation Rate: 90.6%
Meter Conditions
- Normal: 1,240 (77.5%)
- RCNT (Recent): 156 (9.75%)
- Faulty: 120 (7.5%)
- Missing: 84 (5.25%)
- Total Meters: 1,600 (100%)
Recent Validation Issues
Reading ID | Meter ID | Customer | Issue | Date |
|---|---|---|---|---|
RD-7652 | MTR-2589 | Westside Hospital | Consumption spike +258% | May 1, 2025 |
RD-7603 | MTR-1734 | Downtown Office Park | Zero consumption detected | Apr 30, 2025 |
RD-7591 | MTR-5492 | Riverfront Apartments | Reading below min threshold | Apr 29, 2025 |
RD-7512 | MTR-3245 | North Industrial Complex | Inconsistent pattern detected | Apr 28, 2025 |
RD-7498 | MTR-6703 | Sunrise Shopping Center | Missing previous readings | Apr 27, 2025 |
9. Acceptance Criteria
- The system must display real-time validation progress with accurate percentages for the current reading cycle visible to the Meter Manager.
- The dashboard must show the Meter Manager the total number of meters, total reads, validated reads, pending validation, and validation issues.
- The system must calculate and display validation efficiency metrics including overall validation rate and daily trends for the Meter Manager's review.
- The dashboard must provide the Meter Manager with a detailed breakdown of validation categories (auto-corrected, manually verified, exceptions, etc.).
- The system must display meter condition statistics with counts and percentages for each condition type.
- The dashboard must include a graphical representation of meter condition distribution.
- The system must list recent validation issues with appropriate categorization and severity indicators.
- Each validation issue must display reading ID, meter ID, customer name, issue description, and date.
- The system must provide "View" functionality for each validation issue to access detailed information.
- The dashboard must include search functionality for meter reads by meter number or account number.
- The system must provide the Meter Manager with access to configuration sections for validation rules, estimation rules, validator setup, and exemption codes.
- Each configuration section must have appropriate "Configure" or "Manage" options with proper access controls.
- The system must display read cycle validation charts comparing validated readings across cycles.
- The dashboard must include a daily validation trend graph showing performance over time.
- The system must allow the Meter Manager to view detailed validation reports through clearly marked links.
- All metrics and statistics must be updated at least every 15 minutes.
- The dashboard must be responsive and accessible on both desktop and tablet devices for the Meter Manager's use in different work environments.
- The system must provide appropriate notification mechanisms for validation deadlines and critical issues.
- All dashboard data must be exportable in standard formats (CSV, Excel) for the Meter Manager's further analysis.
- The system must enable the Meter Manager to filter and sort validation issues by priority, customer type, and issue category.
10. Process Changes
Current Process | New Process | Impact Analysis |
|---|---|---|
Meter Manager manually tracks validation progress through spreadsheets or multiple system views | Centralized real-time dashboard showing all validation metrics in one place | Reduces Meter Manager's time spent gathering validation status by 75%, enables immediate identification of bottlenecks |
Meter Manager reactively identifies validation issues after they accumulate | Proactive flagging and prioritization of validation issues as they occur | Decreases average resolution time from 3 days to 1 day, improves billing accuracy |
Validation workload managed through manual assignment and tracking by Meter Manager | Automated workload monitoring and balanced assignment through validator setup module | Increases validator productivity by 30%, reduces Meter Manager's administrative overhead by 50% |
Meter Manager handles exception management through multiple systems with inconsistent categorization | Standardized exception management with clear categorization and resolution tracking | Reduces exception handling time by 40%, improves accountability and tracking |
Manual coordination between field verification and validation teams | Integrated field verification requests with tracking and status updates | Decreases Meter Manager's coordination overhead by 60%, reduces follow-up communications |
Fragmented validation rules applied inconsistently across the system | Centralized validation rule configuration with consistent application | Improves validation accuracy by 25%, reduces rule conflicts and errors |
Limited visibility into validation performance metrics for the Meter Manager | Comprehensive validation analytics with historical trending | Enables data-driven process improvements, identifies training opportunities |
Siloed meter condition tracking separate from validation process | Integrated meter condition monitoring within validation dashboard | Facilitates proactive meter maintenance, reduces faulty meter readings by 35% |
11. Impact from Solving This Problem
Metric | Improvement |
|---|---|
Validation Cycle Time | Reduction from 5 days to 2 days per cycle, enabling faster billing processes |
Exception Resolution Rate | Improvement from 60% same-day resolution to 90%, reducing billing delays |
Meter Manager Productivity | 40% increase in oversight capacity, allowing focus on process improvement instead of manual tracking |
Billing Accuracy | Increase from 92% to 98% accuracy due to better validation processes |
Resource Allocation Efficiency | 25% reduction in overtime during validation crunch periods through better workload distribution |
Field Verification Effectiveness | 40% reduction in unnecessary field visits through better issue triage |
Meter Maintenance Efficiency | 30% improvement in proactive meter maintenance based on condition monitoring |
Reporting Time | 85% reduction in time spent generating validation status reports |
Decision-Making Speed | 60% faster response to validation issues through real-time visibility |
Validation Team Performance | 20% improvement in team productivity through better oversight and workload balancing |
12. User Behavior Tracking
Meter Manager
Metric | Events to Track | Properties | Insights Provided |
|---|---|---|---|
Dashboard Usage | Dashboard_Opened, Section_Viewed, Report_Accessed | User_ID, Time_Spent, Sections_Viewed, Time_of_Day | How frequently the Meter Manager uses the dashboard and which sections provide most value |
Validation Progress Monitoring | Progress_Checked, Metric_Filtered, Detailed_View_Accessed | Cycle_ID, Filter_Applied, Action_Taken, Time_to_Action | How the Meter Manager tracks cycle progress and responds to completion metrics |
Issue Response | Issue_Viewed, Priority_Changed, Assignment_Made | Issue_ID, Response_Time, Action_Type, Issue_Category | How quickly and effectively the Meter Manager responds to validation issues |
Configuration Management | Config_Accessed, Rule_Changed, Setting_Updated | Config_Type, Change_Made, Reason_Code, Before_After_Values | How the Meter Manager adjusts validation parameters to improve process |
Report Generation | Report_Generated, Data_Exported, Analysis_Performed | Report_Type, Export_Format, Time_Spent, Frequency | How the Meter Manager uses reporting tools for analysis and decision making |
Resource Management | Workload_Viewed, Assignment_Changed, Performance_Checked | Resource_Type, Change_Made, Performance_Metric | How the Meter Manager allocates resources and monitors team performance |
Meter Condition Analysis | Condition_Report_Viewed, Filter_Applied, Detail_Accessed | Condition_Type, Filter_Criteria, Follow_Up_Action | How the Meter Manager uses condition data to drive maintenance decisions |
Search Behavior | Search_Performed, Filter_Applied, Result_Selected | Search_Term, Filter_Type, Results_Count, Time_to_Select | How the Meter Manager finds specific information and investigates issues |
Key Questions Answered:
- How does the Meter Manager monitor validation progress throughout the cycle?
- Which validation metrics trigger management intervention?
- How effectively is the Meter Manager identifying and addressing validation bottlenecks?
- What configuration changes improve validation performance?
- How does meter condition monitoring affect maintenance and validation decisions?
- Which reports and analytics does the Meter Manager rely on most heavily?
- How does the Meter Manager prioritize and resolve validation issues?
- What patterns in dashboard usage indicate process improvement opportunities?
- How does the Meter Manager's behavior change during different phases of the validation cycle?
- What factors influence resource allocation decisions?
Wireframe
Wireframe: Link
No Comments