User Stroy O&M Dashboard (AX01US03)
1. Problem Statement
User Role: Asset Manager
The Asset Manager is responsible for developing and implementing asset management strategies, prioritizing capital investments, tracking lifecycle costs, and ensuring regulatory compliance for infrastructure assets across the utility's water distribution system.
Pain Points:
- Fragmented Information Display: Critical data is scattered across multiple widgets without clear prioritization or actionable insights, making it difficult to quickly assess overall system health and make informed decisions.
- Reactive vs. Proactive Management: The current interface shows problems after they occur (overdue tasks, emergency work orders, SLA breaches) but lacks predictive capabilities and early warning systems to prevent issues.
- Poor Resource Allocation Visibility: While resource bottlenecks are shown (95% electrical technician utilization), there's no integrated view of how to optimize resource allocation or redistribute workload effectively.
- Disconnected Work Order Management: Active work orders and scheduled maintenance appear separate from asset performance data, making it difficult to understand the relationship between maintenance activities and asset health.
- Limited Predictive Maintenance Integration: Predictive maintenance shows percentage likelihood but lacks integration with work order creation, resource scheduling, and cost impact analysis.
Core Problem:
Asset Managers need a unified, intelligent dashboard that transforms reactive maintenance management into proactive asset lifecycle optimization, with seamless integration across work orders, resource management, predictive analytics, and cross-departmental workflows.
2. Who Are the Users Facing the Problem?
Primary User: Asset Manager
- Develops asset management strategies and policies
- Prioritizes capital investments based on asset condition and criticality
- Tracks lifecycle costs and performance of infrastructure
- Ensures regulatory compliance for infrastructure assets
- Coordinates with O&M, field teams, and customer service departments
Access Requirements:
- Full read/write access to asset management module
- Integration access to work management, resource scheduling, and customer service modules
- Dashboard configuration and customization capabilities
- Advanced analytics and reporting functions
3. Jobs To Be Done
For Asset Manager: When I need to monitor overall asset portfolio health and performance, But I have to switch between multiple disconnected widgets and manually correlate data to understand system-wide status, Help me provide a unified, intelligent dashboard that automatically prioritizes critical issues and shows actionable insights, So that I can quickly assess system health and make informed strategic decisions about asset investments and maintenance priorities.
For Asset Manager: When I need to transition from reactive to predictive maintenance strategies, But I lack integrated tools that connect predictive analytics with work order creation and resource allocation, Help me automatically convert predictive maintenance alerts into scheduled work orders with appropriate resource assignments and priority levels, So that I can prevent asset failures before they impact service delivery and optimize maintenance costs.
For Asset Manager: When I need to optimize resource allocation across competing maintenance priorities, But I have limited visibility into resource availability, technician skills, and work complexity relationships, Help me provide intelligent resource optimization that considers technician specializations, geographic proximity, and work priority levels, So that I can maximize field productivity and minimize service disruptions.
For Asset Manager: When I need to coordinate asset management decisions with customer service and billing impacts, But I lack real-time visibility into how maintenance activities affect customer service levels and revenue, Help me provide integrated dashboards that show the customer and financial impact of asset management decisions, So that I can balance operational efficiency with customer satisfaction and revenue protection.
For Asset Manager: When I need to demonstrate regulatory compliance and asset management effectiveness, But I must manually compile data from multiple systems and create custom reports, Help me provide automated compliance tracking and performance reporting with audit trails and regulatory alignment, So that I can ensure compliance requirements are met and demonstrate asset management value to stakeholders.
4. Solution
Comprehensive Asset Management Intelligence Platform
1. Unified Asset Health Dashboard
- Real-time asset condition scoring with traffic light indicators
- Integrated risk assessment combining condition, criticality, and failure probability
- Actionable insights panel with recommended next steps for each critical item
2. Predictive Maintenance Integration
- Automated work order generation from predictive analytics triggers
- Intelligent scheduling that considers resource availability and asset criticality
- Cost-benefit analysis for predictive vs. reactive maintenance decisions
3. Intelligent Resource Optimization
- Real-time resource capacity planning with skill-based matching
- Geographic work clustering to minimize travel time and costs
- Automated resource reallocation recommendations during emergencies
4. Cross-Departmental Integration Hub
- Customer impact assessment for planned maintenance activities
- Revenue protection analysis for service interruption decisions
- Real-time communication channels with field teams and customer service
5. Advanced Analytics and Reporting
- Customizable KPI dashboards with drill-down capabilities
- Automated regulatory compliance reporting with audit trail documentation
- Asset lifecycle cost analysis with ROI projections for replacement decisions
6. Mobile-First Field Integration
- Seamless synchronization between desktop dashboard and mobile field applications
- Real-time asset condition updates from field technicians
- Photo and video integration for asset condition documentation
7. Emergency Response Coordination
- Automated escalation workflows for critical asset failures
- Emergency resource allocation with customer notification integration
- Service restoration timeline tracking with stakeholder communication
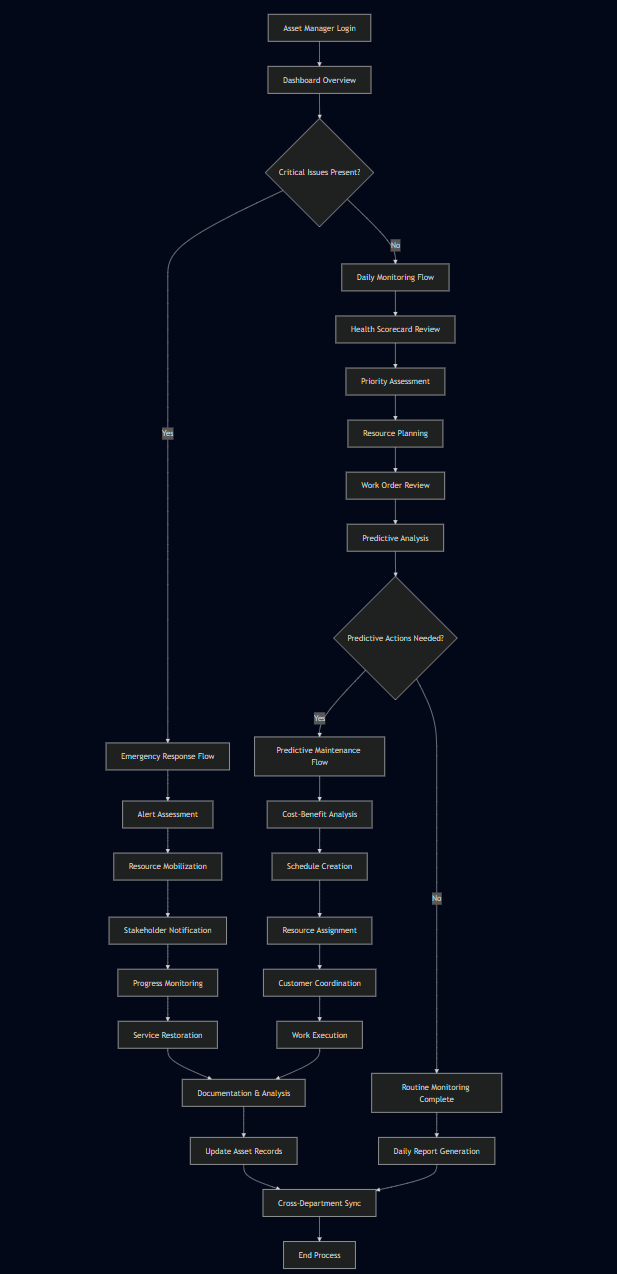
5. Major Steps Involved
Daily Monitoring Flow:
- System Access: Log into SMART360 Asset Management dashboard
- Health Assessment: Review unified asset health scorecard with color-coded status indicators
- Priority Review: Examine automated priority recommendations based on risk scoring
- Resource Check: Verify resource availability and utilization levels across technician categories
- Work Planning: Review pending work orders and scheduled maintenance activities
- Predictive Analysis: Examine predictive maintenance alerts and probability assessments
- Decision Making: Approve recommended actions or modify priorities based on business needs
- Communication: Send updates to relevant departments about planned activities and resource needs
Emergency Response Flow:
- Alert Reception: Receive real-time notification of critical asset failure or anomaly
- Impact Assessment: Access integrated customer impact analysis and service area effects
- Resource Mobilization: Automatically assign emergency response team based on location and skills
- Stakeholder Notification: Trigger automated communications to customer service and affected departments
- Progress Monitoring: Track repair progress through real-time field updates and mobile integration
- Service Restoration: Coordinate service restoration activities with customer notifications
- Post-Incident Analysis: Document lessons learned and update asset condition records
Predictive Maintenance Planning Flow:
- Analytics Review: Access predictive maintenance recommendations with probability scores
- Cost-Benefit Analysis: Review automated cost comparison between preventive and reactive approaches
- Schedule Integration: Convert approved predictions into scheduled work orders
- Resource Allocation: Assign appropriate technicians based on skills and availability
- Customer Communication: Coordinate planned service interruptions with customer service team
- Work Execution: Monitor field execution through mobile integration and real-time updates
- Outcome Documentation: Record results and update predictive models based on actual findings
6. Flow Diagram
7. Business Rules
General Dashboard Business Rules
These rules apply to the entire O&M Dashboard.
- Data Refresh Cadence: The data on this dashboard must be near real-time. Operational data from the CMMS (Computerized Maintenance Management System) and field mobile apps must synchronize within 5 minutes. SCADA and anomaly detection data should be updated every minute. A "Last Updated" timestamp must be visible.
- Default View: On loading, the dashboard will default to showing data for the "Last 30 Days" to provide a relevant operational window.
- Interactivity & Filtering: All widgets, KPIs, and list items are interactive. Clicking a segment (e.g., "Emergency WOs," "HVAC Systems") will filter the entire dashboard to that context. A prominent "Reset Filters" button is required.
- Action Buttons: Buttons like "View Details," "Assign Resources," and "Escalate" are not just links. They must initiate specific workflows within the system (e.g., opening a modal, navigating to a specific pre-filtered screen, triggering a notification).
- Permissions: While the Asset Manager is the primary user, O&M Managers, Schedulers, and Team Leads will also use this dashboard. Permissions will determine which actions are available (e.g., only a manager can approve a schedule change).
- Hover & Tooltips: Every dynamic data element, KPI, and list item will have a detailed tooltip on hover to explain its meaning, calculation, and data source. Hovering over interactive elements will change the cursor to a pointer.
Filter Options
The dashboard must provide the following filtering capabilities:
- Date Range Filter:
- Functionality: Controls the time period for performance metrics and work order lists.
- Default Value: "Last 30 Days."
- Options: Today, Last 7 Days, Last 30 Days, This Quarter, Custom Range.
- Business Rule: All KPIs, charts, and lists will recalculate based on the selected date range.
- Hierarchy Filter (Facility, System, Network):
- Functionality: Narrows the dashboard view to a specific operational area.
- Options: A multi-select dropdown to choose one or more Facilities, Systems, or Networks.
- Business Rule: Applying this filter will scope all dashboard widgets—from KPIs to work order backlogs—to the selected entities.
- Work Order Status Filter:
- Functionality: Allows filtering by the status of work orders.
- Options: Open, In Progress, On Hold, Scheduled, Completed, Canceled.
- Business Rule: This filter primarily affects the "Work Order Backlog," "Active Work Orders," and "Scheduled Maintenance" widgets.
Detailed Business Rules by Dashboard Section
1. Top Navigation Tabs
- Fields: Overview, Financial, O&M, Energy, Inventory, Compliance.
- Business Rules:
- The "O&M" tab is the active view and must be visually distinct.
- Each tab navigates to the corresponding high-level dashboard.
2. Priority Action Bar (Top Row)
This section highlights urgent issues that require immediate attention.
Field Name | Business Rules & Formula | Tooltip Content |
|---|---|---|
Overdue Tasks | Value (7): A count of all work orders where the current date is past the | Title: Overdue Tasks |
Emergency WOs | Value (3): A count of all open work orders with the type reactive. | Title: Emergency Work Orders |
SLA Breaches | Value (2): A count of events in the period where a Service Level Agreement was breached (e.g., response time exceeded, uptime fell below target). Button (View Details): Navigates to a pre-filtered list of these work orders. | Title: SLA Breaches |
WO Completion Rate | Value (87.5%): The percentage of work orders due in the period that were completed. | Title: Work Order Completion Rate |
3. Performance, Quality & Cost KPIs
This section provides a detailed breakdown of operational efficiency.
Widget / Field | Business Rules & Formula | Tooltip Content |
|---|---|---|
Velocity & Performance | First-Time Fix Rate (82.3%): Percentage of repairs completed on the first visit without needing a follow-up. | Title: [Metric Name] |
Quality & Compliance | SLA Achievement (91.5%): Percentage of time service levels were met. | Title: [Metric Name] |
Cost & Resources | Avg Cost/WO ($485): Average total cost total cost of workorders / number of workorders in selected period | Title: [Metric Name] |
4. Work Order Backlog & Asset Performance
Widget / Field | Business Rules & Formula | Tooltip Content |
|---|---|---|
Work Order Backlog | Pending Orders (45): | Title: Work Order Backlog |
Asset Performance by Type | Overall Performance Index (78.5): A weighted average score of asset performance index of all assets. | Title: Asset Performance by Type |
5. Critical & Cost-Related Widgets
Widget / Field | Business Rules & Formula | Tooltip Content |
|---|---|---|
Critical Assets Out of Service | Functionality: A high-visibility list of critical assets that are currently down. | Title: Critical Asset Out of Service |
Unplanned Maintenance Cost Analysis | Ratio (27% / 73%): A visual representation of Unplanned vs. Planned maintenance costs. | Title: Unplanned Maintenance Cost Analysis |
6. Active Work Orders & Scheduled Maintenance
Widget / Field | Business Rules & Formula | Tooltip Content |
|---|---|---|
Active Work Orders | Functionality: A real-time feed of work orders currently "In Progress." View All button to navigate user to the list of work orders with InProgress status | Title: Active Work Order |
Scheduled Maintenance | Functionality: A look-ahead view of planned and preventive maintenance for the next 30 days. | Title: Scheduled Maintenance |
7. Predictive & Performance Widgets
Widget / Field | Business Rules & Formula | Tooltip Content |
|---|---|---|
Real-time Anomalies | Functionality: A watchlist of assets showing early warning signs of failure, based on predictive analytics data fetched form service orders where readings are out form the range | Title: Real-time Anomaly |
Technician Performance | Functionality: A leaderboard or summary of key performance metrics for individual technicians. | Title: Technician Performance |
8. Sample Data
Asset Health Sample:
Asset ID: PUMP-001
Asset Name: Main Pump Station
Location: Downtown Treatment Facility
Health Score: 45% (Critical)
Last Inspection: 2024-12-15
Next Scheduled Maintenance: 2025-01-20
Estimated Replacement Cost: $125,000
Critical Components: Impeller, Motor Bearings
Risk Score: High - Customer Impact 500+ accounts
Work Order Sample:
Work Order: WO-2024-001
Asset: Generator Unit B
Priority: High
Status: In Progress
Assigned Technician: John Smith (Electrical Specialist)
Estimated Duration: 6 hours
Customer Impact: 0 (Backup Generator)
Parts Required: Oil Filter, Spark Plugs
Completion: 75%
Resource Sample:
Resource: Electrical Technicians
Available: 2 of 8 technicians
Current Demand: 6 active assignments
Utilization: 95%
Projected Shortage: 4 hours (Jan 16-17)
Suggested Action: Reschedule non-critical work orders
Predictive Maintenance Sample:
Asset: Pump Station #7
Prediction: Bearing replacement needed
Probability: 89%
Timeline: 2 weeks
Estimated Cost: $15,600 (Preventive) vs $45,000 (Reactive)
Recommended Action: Schedule bearing replacement within 10 days
9. Acceptance Criteria
- The system must display a unified asset health dashboard with real-time status updates for all critical infrastructure components.
- The system must automatically prioritize critical issues using a weighted scoring algorithm considering asset condition, customer impact, and safety factors.
- The system must generate predictive maintenance work orders automatically when failure probability exceeds 70%.
- The system must provide resource optimization recommendations that consider technician skills, location, and current workload.
- The system must integrate with customer service systems to provide real-time customer impact assessments for planned maintenance.
- The system must synchronize with mobile field applications every 30 minutes and support offline capability for remote locations.
- The system must generate automated regulatory compliance reports with complete audit trail documentation.
- The system must provide cost-benefit analysis for all predictive maintenance recommendations with ROI calculations.
- The system must send automatic notifications to relevant departments when critical thresholds are exceeded.
- The system must support drag-and-drop work order rescheduling with automatic resource conflict detection.
- The system must maintain 99.5% uptime during business hours with automatic failover capabilities.
- The system must process work order updates from field technicians within 2 minutes of submission.
- The system must provide customizable dashboard views for different user roles and responsibilities.
- The system must integrate with GIS systems to provide geographic clustering of maintenance activities.
- The system must support batch work order creation for planned maintenance programs.
- The system must validate resource assignments against technician certifications and prevent invalid assignments.
- The system must provide emergency escalation workflows that automatically engage management after specified timeframes.
- The system must maintain historical performance data for trend analysis and predictive model improvement.
- The system must support multi-level approval workflows for high-cost maintenance and replacement decisions.
- The system must provide real-time collaboration tools for cross-departmental coordination during emergency responses.
10. Process Changes
Current Process | New Process | Impact Analysis |
|---|---|---|
From: Manual daily review of separate asset condition reports and work order lists To: Unified intelligent dashboard with automated priority ranking and actionable insights | Reduces daily monitoring time by 60% and improves decision accuracy through integrated risk assessment | |
From: Reactive maintenance triggered by equipment failures To: Proactive predictive maintenance with automated work order generation | Reduces emergency repairs by 40% and decreases maintenance costs by 25% through preventive interventions | |
From: Manual resource allocation based on availability spreadsheets To: Intelligent resource optimization with skill-based matching and geographic clustering | Improves technician utilization by 30% and reduces travel time by 35% through optimized scheduling | |
From: Separate communication with customer service about maintenance impacts To: Integrated customer impact assessment with automated stakeholder notifications | Reduces customer complaints by 50% and improves service restoration time by 25% through better coordination | |
From: Manual compliance reporting requiring data compilation from multiple systems To: Automated regulatory compliance tracking with real-time audit trail generation | Reduces compliance reporting time by 80% and eliminates reporting errors through automated data validation | |
From: Emergency response coordination through phone calls and email To: Automated emergency workflows with real-time resource mobilization and progress tracking | Reduces emergency response time by 45% and improves communication effectiveness during critical incidents | |
From: Manual cost analysis for maintenance vs. replacement decisions To: Automated lifecycle cost analysis with ROI projections and decision support | Improves capital planning accuracy by 35% and optimizes maintenance vs. replacement decisions through data-driven insights |
11. Impact from Solving This Problem
Metric Category | Improvement | Description |
|---|---|---|
Operational Efficiency | 40% reduction in emergency repairs | Predictive maintenance prevents failures before they occur, reducing costly emergency interventions |
Cost Management | 25% decrease in maintenance costs | Proactive maintenance and intelligent resource allocation optimize spending and extend asset life |
Customer Satisfaction | 50% reduction in service interruption complaints | Better planning and communication reduce customer impact and improve service reliability |
Resource Utilization | 30% improvement in technician productivity | Intelligent scheduling and geographic clustering maximize field efficiency and reduce travel time |
Compliance Management | 80% reduction in compliance reporting time | Automated tracking and reporting eliminate manual compilation and reduce regulatory risk |
Decision Making Speed | 60% faster strategic decision making | Unified dashboards and automated insights enable quicker, more informed asset management decisions |
Asset Lifespan | 15% extension of average asset life | Predictive maintenance and condition monitoring optimize asset performance and longevity |
Emergency Response | 45% faster response time | Automated workflows and resource mobilization improve critical incident management |
12. User Behavior Tracking
Asset Manager Tracking Plan:
Event Category | Specific Events | Properties Tracked | Key Questions Answered |
|---|---|---|---|
Dashboard Usage | Login frequency, Time spent on dashboard, Widget interaction patterns | Session duration, Click paths, Feature utilization | How often do Asset Managers engage with the system? Which features provide the most value? |
Work Order Management | Work order creation, Priority modifications, Resource assignments | Work order types, Priority levels, Assignment changes | Are predictive work orders reducing emergency incidents? How are priorities being adjusted? |
Resource Optimization | Resource allocation decisions, Schedule modifications, Utilization monitoring | Resource types, Schedule changes, Utilization rates | Is intelligent resource allocation improving efficiency? Where are the bottlenecks? |
Predictive Maintenance | Alert acknowledgment, Work order conversion rates, Cost-benefit analysis usage | Alert types, Conversion rates, ROI calculations | Are predictive insights being acted upon? What's the conversion rate from prediction to action? |
Emergency Response | Emergency alert response time, Resource mobilization speed, Resolution tracking | Response times, Resource assignments, Resolution outcomes | How quickly are emergencies being addressed? What's the effectiveness of automated workflows? |
Cross-Department Coordination | Customer service notifications, Billing integration usage, Field team communication | Notification types, Integration frequency, Communication patterns | How well is the system facilitating cross-departmental collaboration? |
Compliance and Reporting | Report generation frequency, Audit trail access, Regulatory documentation | Report types, Access patterns, Documentation completeness | Are compliance requirements being met efficiently? What reports are most valuable? |
Key Insights from Tracking:
- Predictive Maintenance Adoption: Measuring conversion rates from predictive alerts to work orders indicates system effectiveness
- Resource Optimization Impact: Tracking utilization improvements and travel time reductions validates intelligent scheduling
- Emergency Response Effectiveness: Monitoring response times and resolution rates demonstrates crisis management improvement
- User Engagement Patterns: Understanding feature usage helps optimize interface design and training needs
- Cross-System Integration Success: Measuring integration usage indicates effectiveness of unified workflows
- Compliance Efficiency: Tracking reporting automation usage shows regulatory management improvement
No Comments