User Story: Facility Management (AX02US01)
1. Problem Statement
User Role: Asset Manager (Facility & Asset Registry Focus)
The Asset Manager responsible for facility and asset registry management oversees the complete asset hierarchy from facilities down to individual components, manages asset condition and risk assessments, coordinates preventive maintenance schedules, and ensures accurate asset data that supports operational, financial, and compliance decision-making across the utility.
Pain Points:
- Complex Multi-Level Asset Hierarchy Management: Managing the relationship between facilities (5 total), systems (3 active), networks (2 connected), and individual assets (12 total) requires manual coordination across multiple interfaces, leading to data inconsistencies and broken relationships in the asset hierarchy.
- Disconnected Condition and Risk Assessment: Facility condition scores (82 - Good) and risk scores (65 - Medium) are assessed separately from individual asset conditions, missing opportunities to understand how component-level issues aggregate to system and facility-level risks.
- Manual Asset Registration and Onboarding: The facility creation process requires extensive manual data entry across multiple screens (identification, location, operational parameters, financial data, documentation) without intelligent defaults or automated discovery capabilities.
- Fragmented Preventive Maintenance Scheduling: PM schedules exist separately from asset condition monitoring and risk assessment, leading to maintenance activities that may not align with actual asset needs or facility-level priorities (e.g., Pipeline Integrity Inspection shows "Overdue" status).
- Poor Integration Between Asset Registry and Operational Systems: Asset data captured in the registry doesn't automatically flow to work order management, compliance monitoring, or performance dashboards, requiring manual data synchronization and increasing the risk of operational decisions based on outdated asset information.
Core Problem:
Asset Managers need an intelligent, integrated facility and asset registry system that automatically maintains asset hierarchies, connects condition and risk assessments across all levels, streamlines asset onboarding through automation and discovery, and seamlessly integrates asset data with operational workflows to ensure accurate, real-time asset information supports all utility operations.
2. Who Are the Users Facing the Problem?
Primary User: Asset Manager (Facility & Asset Registry Focus)
- Develops and maintains comprehensive asset registries and hierarchies
- Oversees facility onboarding and asset discovery processes
- Coordinates condition and risk assessments across facility, system, and asset levels
- Integrates asset registry data with operational, maintenance, and compliance systems
- Ensures asset data quality and completeness for decision-making across the utility
Access Requirements:
- Full read/write access to facility and asset registry modules
- Integration access to GIS systems for location-based asset management
- Dashboard configuration for asset hierarchy visualization and condition monitoring
- Advanced data management tools for bulk import/export and data validation
3. Jobs To Be Done
For Asset Manager: When I need to onboard new facilities and establish asset hierarchies, But I have complex multi-screen processes that require extensive manual data entry without intelligent automation or asset discovery capabilities, Help me provide streamlined facility registration with automated asset discovery, intelligent data prefilling, and integrated hierarchy creation, So that I can rapidly establish complete asset registries with accurate relationships and reduce onboarding time while ensuring data quality.
For Asset Manager: When I need to maintain accurate asset condition and risk assessments across facility, system, and individual asset levels, But I have disconnected assessment processes that don't show how component conditions aggregate to higher-level facility risks, Help me provide integrated condition assessment that automatically correlates individual asset health with system and facility-level risk scoring and performance metrics, So that I can understand true facility health and make informed maintenance and investment decisions based on comprehensive risk analysis.
For Asset Manager: When I need to coordinate preventive maintenance scheduling with asset condition and facility priorities, But I have separate PM scheduling that doesn't integrate with real-time asset condition monitoring or facility-level operational requirements, Help me provide intelligent maintenance scheduling that considers asset condition trends, facility risk scores, and operational constraints to optimize maintenance timing and resource allocation, So that I can ensure maintenance activities address the highest-priority asset needs while minimizing facility operational disruption.
For Asset Manager: When I need to ensure asset registry data seamlessly supports all operational workflows, But I have siloed asset data that requires manual synchronization with work orders, compliance monitoring, and performance management systems, Help me provide real-time asset data integration that automatically updates operational systems when asset information changes and feeds operational insights back into the asset registry, So that I can ensure operational decisions are always based on current asset information and asset records reflect actual operational experiences.
For Asset Manager: When I need to manage complex asset relationships and dependencies across facilities, systems, networks, and individual components, But I have fragmented asset management that makes it difficult to understand how failures or maintenance in one area impacts connected systems and overall facility performance, Help me provide comprehensive asset relationship mapping with impact analysis and dependency visualization, So that I can understand system interdependencies and make informed decisions about maintenance priorities and operational changes.
4. Solution
Intelligent Facility & Asset Registry Platform
1. Automated Asset Discovery and Onboarding
- Smart facility creation wizard with intelligent data prefilling based on location and facility type
- Automated asset discovery through IoT sensors, SCADA integration, and GIS mapping
- Bulk asset import capabilities with automated validation and hierarchy establishment
2. Integrated Multi-Level Condition and Risk Assessment
- Unified condition scoring that aggregates individual asset health to system and facility levels
- Intelligent risk assessment that considers asset interdependencies and operational criticality
- Automated condition trend analysis with predictive deterioration modeling
3. Intelligent Preventive Maintenance Integration
- Condition-based maintenance scheduling that adapts to actual asset health and performance
- Facility-level maintenance optimization that considers operational priorities and resource constraints
- Automated PM schedule adjustments based on asset condition changes and risk assessments
4. Real-Time Asset Data Integration Hub
- Seamless integration with work order management, compliance monitoring, and operational dashboards
- Automated asset data synchronization across all utility systems
- Real-time operational feedback integration that updates asset performance records
5. Comprehensive Asset Relationship Management
- Visual asset hierarchy management with drag-and-drop relationship creation
- Impact analysis tools that show how asset changes affect connected systems
- Dependency mapping that supports informed maintenance and operational decision-making
6. Advanced Asset Analytics and Reporting
- Performance benchmarking across similar assets and facilities
- Asset lifecycle cost analysis with replacement optimization recommendations
- Customizable asset dashboards for different management levels and operational needs
7. Mobile Asset Management
- Field-accessible asset registry with offline capabilities for remote locations
- Mobile asset condition updates with photo and video documentation
- QR code and RFID integration for rapid asset identification and data access
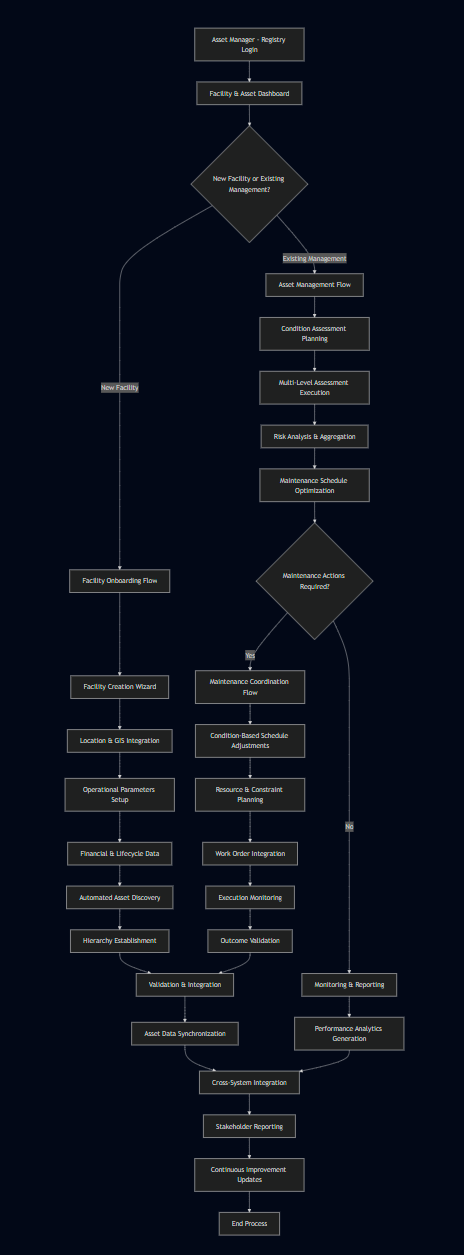
5. Major Steps Involved
Facility Onboarding Flow:
- Facility Creation Initiation: Access "Add New Facility" workflow from facilities registry
- Intelligent Data Entry: Complete facility identification with auto-suggested facility types and naming conventions
- Location Integration: Use integrated GIS mapping to set precise facility location with coordinate validation
- Operational Parameters: Define capacity, service zones, and operational characteristics with template-based defaults
- Financial Setup: Enter lifecycle cost data, budgets, and depreciation information
- Documentation Management: Upload facility-wide documents with automated categorization and indexing
- Asset Discovery: Initiate automated asset discovery process using connected systems and manual verification
- Hierarchy Establishment: Review and approve suggested asset relationships and system connections
- Validation and Activation: Complete facility setup with data quality validation and operational integration
Asset Condition and Risk Assessment Flow:
- Multi-Level Assessment Planning: Schedule coordinated assessments across facility, system, and asset levels
- Individual Asset Evaluation: Conduct detailed asset condition assessments using standardized criteria
- System-Level Aggregation: Automatically calculate system condition scores based on component asset health
- Facility Risk Analysis: Generate facility-level risk scores considering asset conditions, operational criticality, and interdependencies
- Trend Analysis: Compare current assessments with historical data to identify deterioration patterns
- Impact Assessment: Analyze how asset conditions affect facility performance and operational reliability
- Maintenance Prioritization: Generate maintenance recommendations based on integrated condition and risk analysis
- Stakeholder Communication: Distribute assessment results to relevant operational and management teams
Preventive Maintenance Coordination Flow:
- Schedule Optimization Analysis: Review current PM schedules against asset condition data and facility priorities
- Condition-Based Adjustments: Modify maintenance frequencies based on actual asset performance and degradation rates
- Resource Allocation Planning: Coordinate maintenance scheduling with technician availability and operational constraints
- Cross-System Coordination: Ensure maintenance activities consider asset interdependencies and minimize operational disruption
- Work Order Integration: Generate and coordinate work orders that align with optimized maintenance schedules
- Progress Monitoring: Track maintenance completion and effectiveness against asset condition improvements
- Schedule Validation: Verify maintenance outcomes and adjust future scheduling based on results
- Continuous Improvement: Update maintenance strategies based on asset performance and operational feedback
6. Flow Diagram
7. Business Rules
1. Page Header & Breadcrumbs
2. Primary KPIs (Top Row)
This section provides a high-level summary of the entire facility portfolio.
Field Name | Business Rules & Formula | Tooltip Content |
|---|---|---|
Total Facilities | Value (5): A distinct count of all facilities registered in the system, regardless of their status. Formula: | Title: Total Facilities Description: "The total number of facilities, including active and inactive, that are registered in the system." |
Operational | Value (4): A count of all facilities with a status of 'Active' or 'Operational'. Formula: | Title: Operational Facilities Description: "The number of facilities that are currently active and in service." |
Avg Condition Score | Value (78): The weighted average of the condition scores of all operational facilities. Formula: Business Rule: The score is categorized (e.g., 0-40=Poor, 41-75=Fair, 76-100=Good). The color of the card (yellow for 'Fair') should reflect this category. | Title: Average Condition Score Description: "The weighted average health score across all operational facilities. This score is derived from the aggregated condition of its underlying systems and assets." |
Total Capacity | Value (280): The sum of the design capacity for all operational facilities. Formula: Unit: MLD (Megaliters per Day). | Title: Total Capacity Description: "The combined total design capacity (in Megaliters per Day) of all currently operational facilities." |
3. Action & Search Bar
This section provides tools for managing and filtering the registry list.
Field Name | Business Rules |
|---|---|
Search Facilities... | Functionality: A free-text search box. Business Rule: As the user types, the "Facilities Registry" list below will dynamically filter to show only facilities where the |
Filters | Functionality: Opens a dropdown or modal with advanced filtering options. Filter Options: • Type: Multi-select checklist of all available facility types (e.g., Water Treatment Plant, Pumping Station). • Zone/Division: Multi-select checklist of all defined zones. <br> • Condition: Multi-select checklist of condition statuses (Good, Fair, Poor). • Status: Multi-select checklist of operational statuses (Operational, Inactive, Under Construction). Business Rule: Applying a filter updates the registry list and recalculates the KPIs at the top to reflect the filtered data set. |
Export | Functionality: Exports the currently displayed list of facilities. Business Rule: Clicking this button will generate and download a CSV or Excel file. The exported file must respect any active search or filter criteria. The columns in the export should match the columns in the registry table. |
Bulk Add | Functionality: Opens a modal for importing multiple facilities from a file. Business Rule: The user can download a template (CSV/Excel), fill it out, and upload it. The system must validate the uploaded data against the business rules for each field before importing. A summary of successful and failed imports must be shown to the user. |
Add New Facility | Functionality: Navigates the user to the first screen of the multi-step "Create New Facility" wizard. Business Rule: This button is the primary entry point for manually onboarding a single new facility. |
4. Facilities Registry Table
This table lists all facilities and their key operational data.
Column Name | Business Rules & Formula | Tooltip Content |
|---|---|---|
Facility ID | A unique, system-generated, or user-defined identifier for the facility (e.g., FAC-001). This is the primary key. Clicking the ID navigates to the detailed view of that facility. | Title: Facility ID Description: "The unique identifier for the facility. Click to view the facility's detailed profile." |
Name | The common name of the facility (e.g., Water Treatment Plant A). | Title: Facility Name Description: "The common name of the facility." |
Type | The classification of the facility. This must be a value from a pre-defined list managed in Settings. | Title: Facility Type Description: "The primary function or classification of the facility." |
Zone / Division | The geographical or administrative zone the facility belongs to. This must be a value from a pre-defined list. | Title: Zone / Division Description: "The operational or geographical district this facility belongs to." |
Systems | The total number of child "Systems" associated with this facility in the asset hierarchy. Formula: | Title: Systems Count Description: "The total number of distinct operational systems contained within this facility." |
Assets | The total number of individual "Assets" associated with this facility. Formula: | Title: Assets Count Description: "The total number of individual assets registered to this facility." |
Condition Score | The calculated health score for the specific facility, from 0-100. Business Rule: The score is displayed with a color-coded tag (e.g., 85 = Good, 72 = Fair) based on pre-defined thresholds in Settings. This score is an aggregation of the conditions of its child systems and assets. | Title: Condition Score Description: "The overall health score of this facility, aggregated from the condition of its systems and assets. (Good: 76-100, Fair: 41-75, Poor: 0-40)." |
Design / Current Capacity (MLD) | Design (e.g., 50): The maximum capacity the facility was designed to handle. This is a static value. Current (e.g., 45.2): The actual, real-time operational capacity, which may be lower due to asset condition or operational issues. Unit: MLD (Megaliters per Day). | Title: Design / Current Capacity Description: "The facility's original design capacity versus its current operational capacity, which can be affected by asset condition and performance." |
Actions | A "kebab" menu ( Options: • View Details: Navigates to the facility's detailed profile page. • Edit: Opens the "Edit Facility" wizard. • Deactivate/Activate: Toggles the operational status of the facility. • Delete: Permanently removes the facility (requires confirmation and is only possible if no child assets are linked). | Title: Actions Description: "Perform an action on this facility record." |
Pagination | Controls for navigating through a large list of facilities. Show per page: A dropdown to select the number of rows to display (e.g., 10, 25, 50, 100). | N/A |
Add Form
1. Page Header & Navigation
Element | Business Rules |
|---|---|
Breadcrumbs ( | Shows the user's current location. "add-facility" indicates they are in a creation workflow. |
Back to Facilities Button | Functionality: Navigates the user back to the main "Facilities Registry" screen. <br> Business Rule: If the user has entered any data, a confirmation modal must appear before navigating away, warning them that "Unsaved changes will be lost. Are you sure you want to continue?". |
Page Title ( | A clear title indicating the purpose of the screen. |
Subtitle | "Create a new facility in the utility system." |
2. Section: Facility Identification & Role
This section captures the most basic identifying information for the facility.
Field Name | Business Rules & Formula | Tooltip Content |
|---|---|---|
Facility ID* | Functionality: A unique identifier for the facility. Business Rules: • The system automatically suggests a unique ID (e.g., • Validation: Must not be empty. | Title: Facility ID Description: "A unique system identifier for the facility. It is auto-generated but can be overridden. Must be unique across all facilities." |
Facility Name* | Functionality: The common, human-readable name for the facility. Placeholder: "e.g., Northwood Regional Water Treatment Plant" Validation: Must not be empty. Maximum length of 255 characters. | Title: Facility Name Description: "The full, descriptive name of the facility." |
Facility Type* | Functionality: A dropdown menu to classify the facility. Business Rules: • The user must select one type from the list. • The list of options is dynamic and managed under Options Shown: Water Treatment Plant, Wastewater Treatment Plant, Water Pumping Station, etc. | Title: Facility Type Description: "Select the primary function of this facility. This classification determines available parameters and reporting categories." |
Operating Status* | Functionality: A dropdown to set the current operational status. Business Rules: • The list of options is managed in Settings. • Standard Options: Operational, Inactive, Under Construction, Decommissioned. • The selection here will determine if the facility is included in KPIs like "Operational Facilities" and "Total Capacity". | Title: Operating Status Description: "The current operational status of the facility. This affects its inclusion in performance calculations." |
Operational Hours* | Functionality: A dropdown to define the facility's standard operating schedule. Business Rules: • The list of options is dynamic and managed in Settings. • Options Shown: 24/7 - Continuous Operations, 16/5 - 16 hours/day, 5 days/week, On-Demand, Seasonal. • This information can be used by the O&M and Energy modules to schedule maintenance or analyze off-peak energy usage. | Title: Operational Hours Description: "The standard operating schedule for this facility. This helps in planning maintenance and analyzing performance." |
3. Section: Location & Responsibility
| Field Name | Functionality | Business Rules & Formula | Tooltip Content |
|---|---|---|---|
Address / Site Label | A text field for a descriptive location label or address. | - This field can be auto-populated based on the location pinned on the map using a reverse geocoding service. - The user can manually edit or override the auto-populated value. - Validation: Optional, but recommended. | Title : Address / Site Label Description : The physical street address or a descriptive site label for the facility's location. |
Map Pin Location | An interactive map for setting the precise geographic coordinates. | - This is an embedded map interface (e.g., Leaflet, ArcGIS, Google Maps). - The user can click on the map to place a pin. - Placing the pin automatically populates the Latitude and Longitude fields. - The user can also search for an address within the map to move the view. | Title : Map Pin Location Description : Click on the map to set the precise geographic location of the facility. This will auto-populate the latitude and longitude. |
Latitude * | The geographic latitude of the facility. | - This field is auto-populated when the user clicks on the map. - It can also be manually entered. If entered manually, the pin on the map must move to the corresponding location. - Validation: Must be a valid numerical latitude value (between -90 and 90). | Title : Latitude Description : The geographic latitude of the facility. Auto-filled from the map or can be entered manually. |
Longitude * | The geographic longitude of the facility. | - This field is auto-populated when the user clicks on the map. - It can also be manually entered. If entered manually, the pin on the map must move to the corresponding location. - Validation: Must be a valid numerical longitude value (between -180 and 180). | Title : Longitude Description : The geographic longitude of the facility. Auto-filled from the map or can be entered manually. |
Area * | A dropdown to assign the facility to a predefined geographical or administrative area. | - The list of options (e.g., North District, Central District) is managed in Settings. - This is used for regional filtering and reporting. | Title : Area Description : Assign this facility to a predefined operational area or district for reporting and management. |
Facility Manager / Lead Contact * | A searchable dropdown to assign a primary point of contact. | - This dropdown searches the system's user directory. - When a user is selected, their contact details (Phone, Email) are automatically populated in the read-only fields below. | Title : Facility Manager / Lead Contact Description : The primary point of contact responsible for this facility. Their contact details will be auto-populated. |
Contact Details | Read-only fields displaying the selected manager's contact info. | - These fields are not editable and update automatically when the "Facility Manager" selection changes. | N/A |
4. Other Sections
| Field Name | Functionality & Business Rules | Tooltip Content |
|---|---|---|
Overall Design Capacity (MLD)* | - The maximum capacity the facility was designed for. - Placeholder: "e.g., 30.5" - Validation: Must be a positive numerical value. | Title : Overall Design Capacity Description : The maximum design capacity of the facility in Megaliters per Day (MLD). |
Service Zone / Division* | - A dropdown to assign the facility to a service zone. - May be the same as or a sub-category of the "Area" field. - List managed in Settings for granular operational control. | Title : Service Zone / Division Description : The specific service zone this facility supports. Used for operational and customer impact analysis. |
| Field Name | Functionality & Business Rules | Tooltip Content |
|---|---|---|
Commissioned Date* | - The date the facility officially went into service. - Must use a date picker. - Cannot be a future date. - Used to calculate asset's age. | Title : Commissioned Date Description : The date the facility was officially placed into service. This is used as the start date for its operational life. |
Design Useful Life (Years)* | - Expected operational lifespan in years. - Placeholder: "e.g., 50" - Validation: Must be a positive integer. | Title : Design Useful Life Description : The expected number of years this facility is designed to operate before requiring major overhaul or replacement. |
Annual Facility O&M Budget ($)* | - Budgeted annual operations and maintenance cost. - Placeholder: "e.g., 2500000" - Validation: Must be a positive numerical value. | Title : Annual O&M Budget Description : The budgeted annual cost for all operations and maintenance activities for this facility. |
Depreciation Schedule | - Dropdown (monthly, quarterly, annual) | Description: Calculate depreciation based on schedule |
| Field Name | Functionality & Business Rules | Tooltip Content |
|---|---|---|
Facility-Wide Documents | - Drag-and-drop area for uploading documents. - Supports multiple file uploads. - Allowed file types: PDF, DOCX, XLSX, JPG, PNG. - Progress bar displayed during upload. - Files are linked to this facility’s record. - Example documents: Site Plans, Permits, Reports, As-Built Drawings. | Title : Facility-Wide Documents Description : Upload important documents that apply to the entire facility, such as permits, site plans, or warranties. |
5. Page Actions
| Button | Business Rules & Functionality |
|---|---|
Cancel | Functionality : Discards all entered information and returns the user to the "Facilities Registry" screen. Business Rule : This action is identical to the "Back to Facilities" button and must trigger the same "Unsaved changes" confirmation modal if any data has been entered. |
Create Facility | Functionality : Submits the form to create a new facility record. Business Rules : • This button is disabled until all mandatory fields (marked with *) are filled with valid data. • On click, the system performs a final validation of all entered information. • If validation succeeds, the facility record is created in the database and the user is navigated to the next step in the wizard (such as "Asset Discovery" or the new facility's detailed profile page). • If validation fails, the button remains disabled, and error messages are shown next to the problematic fields. |
Detailed View
1. Page Header & Breadcrumbs
| Element | Business Rules & Functionality |
|---|---|
Breadcrumbs (Dashboard > Facilities > Water Treatment Plant A) | Shows the user's current location in the navigation hierarchy. "Dashboard" and "Facilities" are clickable links that take the user to their respective pages. "Water Treatment Plant A" represents the current page and is not clickable. |
Page Title (FAC-001) | The main title displays the unique Facility ID, reinforcing the identity and context of the page. |
Subtitle | Provides a brief description: "Comprehensive facility information and operational details." |
2. Section: Facility Information
This section displays the core, static identification data for the facility.
| Field Name | Business Rules & Functionality | Tooltip Content |
|---|---|---|
Facility ID | The unique identifier for the facility. This is a read-only display of the primary key. | Title : Facility ID Description : The unique identifier for this facility. |
Facility Name | The common name of the facility. Read-only display. | Title : Facility Name Description : The common name of this facility. |
Facility Type | The classification of the facility. Read-only display. | Title : Facility Type Description : The primary function or classification of this facility. |
Commission Date | The date the facility was placed into service. Read-only display. | Title : Commissioned Date Description : The date this facility was officially placed into service. |
Contact Person | The primary point of contact for this facility. Read-only display. | Title : Contact Person Description : The primary point of contact responsible for this facility. |
Contact | The phone number of the contact person. Read-only display. | Title : Contact Information Description : The primary phone number for the lead contact. |
Location | The general district or location of the facility. Includes a "View on map" clickable link that opens a modal or navigates to a GIS view showing the facility’s precise location on a map. | Title : Location Description : The general district where this facility is located. Click 'View on map' for the precise geographic location. |
Area | The specific administrative or operational area. Read-only display. | Title : Area Description : The specific operational area this facility belongs to. |
Zones / Divisions Served | A list of specific service zones this facility supports. Displayed as tags. If there are more than 3–4 zones, the list is truncated with a "+X more" indicator. | Title : Zones / Divisions Served Description : A list of all the specific service zones that receive service from this facility. |
Description | A brief, human-readable description of the facility’s purpose and function. Read-only display. | Title : Description Description : A summary of the facility's function and key characteristics. |
3. Section: Key Metrics
This section displays high-level, aggregated performance indicators for the facility.
| Field Name | Business Rules & Formula | Tooltip Content |
|---|---|---|
Current Capacity (MLD) | - Value (e.g., 45.2 / 50): Represents the current operational capacity versus the total design capacity. - Formula (Current): Calculated based on the operational status and performance of critical child assets. - Formula (Design): Static value from the Design_Capacity field. - Percentage (e.g., 90%): (Current Capacity / Design Capacity) × 100. A progress bar visualizes this percentage. | Title : Current Capacity Description : The current operational capacity versus the original design capacity. A reduction can indicate performance issues or assets being out of service. |
Systems | - Value (e.g., 3): Distinct count of all active systems that are children of this facility. - Formula: COUNT(Systems) WHERE Parent_Facility_ID = 'FAC-001' AND Status = 'Active' | Title : Active Systems Description : The number of active operational systems contained within this facility. Click to view the list of systems. |
Networks | - Value (e.g., 2): Distinct count of all networks connected to this facility. - Formula: COUNT(Networks) WHERE Connected_Facility_ID = 'FAC-001' | Title : Connected Networks Description : The number of distribution or collection networks connected to this facility. Click to view the list of networks. |
Assets | - Value (e.g., 12): Distinct count of all individual assets that belong to this facility. - Formula: COUNT(Assets) WHERE Parent_Facility_ID = 'FAC-001' | Title : Total Assets Description : The total number of individual assets registered to this facility. Click to view the list of assets. |
4. Section: Key Stats (Right Sidebar)
| Field Name | Business Rules & Formula | Tooltip Content |
|---|---|---|
Age | - Value (e.g., 7 years): The calculated age of the facility. - Formula: Current Date − Commissioned Date. Displayed in years, rounded to the nearest whole number or one decimal place. | Title : Facility Age Description : The operational age of the facility, calculated from its commissioned date. |
Condition | - Value (e.g., 85): Current condition score of the facility. - Rule: Aggregated from the condition scores of child systems and assets. - Displayed with a color-coded tag (e.g., Good) based on pre-defined thresholds. | Title : Condition Score Description : The overall health score of this facility, aggregated from its underlying components. (Good: 76–100, Fair: 41–75, Poor: 0–40). |
Risk Score | - Value (e.g., 82): Calculated risk score. - Rule: Combines probability of failure (based on condition) with consequence of failure (criticality). - Shown with a color-coded tag indicating risk level. | Title : Risk Score Description : A score representing the overall risk posed by this facility, combining the likelihood of failure with the consequence of that failure. |
Efficiency | - Value (e.g., 90%): Composite score of operational efficiency. - Formula: May include weighted average of metrics like (Current Capacity ÷ Design Capacity), energy efficiency, and chemical usage efficiency. | Title : Operational Efficiency Description : A composite score measuring the overall operational efficiency of the facility, including factors like capacity utilization and energy performance. |
5. Section: Quick Actions (Right Sidebar)
This provides a list of common tasks the user can perform for this facility.
| Action | Business Rules & Functionality |
|---|---|
Edit Facility | Navigates the user to the "Edit Facility" wizard. The form is pre-populated with the existing data of the facility. |
Duplicate Facility | Initiates a workflow to create a new facility using this one as a template. Opens the "Add New Facility" screen, pre-populated with all data from the current facility (e.g., FAC-001), except for the Facility ID which will be newly generated. Useful for quickly creating similar facilities. |
Create Service Order | Creates a new work order (service order) associated with this facility. Opens the "Create Service Order" form with the "Facility" field pre-populated as "FAC-001 – Water Treatment Plant A". |
Delete Facility | Permanently deletes the facility record. This action must trigger a confirmation modal with the message: "This action is irreversible and will permanently delete the facility. Are you sure?" Deletion must be blocked if any child Systems or Assets are still associated with the facility. The user must reassign or delete all child objects before proceeding. If child objects exist, the Delete button should be disabled and include a tooltip explaining the restriction. |
Performance Tab
1. Section: Performance Overview
This section provides a comprehensive summary of the facility's health and operational status.
| Field Name | Business Rules & Formula | Tooltip Content |
|---|---|---|
Facility Health Index | - Value (e.g., 87.3): Composite score representing overall facility health. - Formula: Weighted average of Condition Score of all assets in that facility. - Trend (e.g., ↑2.1% from last month): Change compared to previous month. | Title : Facility Health Index Description : A consolidated score (0–100) indicating overall health of this facility, combining asset condition, risk, and operational performance. |
Asset Availability | - Value (e.g., 94.2%): Percentage of time assets were operational. - Formula: (SUM(Scheduled Operating Time) − SUM(Unplanned Downtime)) / SUM(Scheduled Operating Time) × 100 for all assets in this facility. - Trend (e.g., ↑1.3% from last month): Monthly comparison. | Title : Asset Availability Description : Percentage of time assets were available to perform required functions during the selected period. |
Out of Service | - Value (e.g., 8 (5.8%)): Count and percentage of assets currently inactive. - Formula (Count): COUNT(Assets) WHERE Parent_Facility_ID = [This Facility] AND Status = 'Out of Service'. - Formula (%): (Out of Service Count / Total Assets) × 100. - Trend (e.g., ↑2 from last month): Change in number. | Title : Out of Service Assets Description : Total number and percentage of assets currently inactive or not operational within this facility. |
Avg Remaining Life | - Value (e.g., 12.4 yrs): Average remaining useful life of assets. - Formula: SUM(Asset RUL) / COUNT(Assets) for all assets in facility. - Trend (e.g., ↓0.8 yrs from last quarter): Comparison to previous quarter's average. | Title : Average Remaining Life Description : Average years remaining before assets reach end of service life. |
Inspection Compliance | - Value (e.g., 91.7%): Percentage of scheduled inspections completed on time. - Formula: (COUNT(Completed Inspections) / COUNT(Scheduled Inspections)) × 100 for this facility. - Visual: Line graph shows trend over recent periods. | Title : Inspection Compliance Description : Percentage of required inspections completed by their due date for this facility and its assets. |
Overall Risk Score | - Value (e.g., 23): Aggregated risk score for the facility. - Formula: Criticality-weighted average of risk scores of all assets. - Subtitle (e.g., Low risk): Qualitative risk level based on score (0–30 = Low, 31–70 = Medium, 71–100 = High). | Title : Overall Risk Score Description : Aggregated risk score combining probability and consequence of failure for all assets. Lower score indicates lower risk. |
Service Level Achievement | - Value (e.g., 96.8%): Percentage of time service level targets were met (e.g., water pressure, quality). - Formula: (Time Met Service Level / Total Time) × 100. | Title : Service Level Achievement Description : Percentage of time operational service levels (pressure, flow, quality) were achieved by this facility. |
2. Section: Energy Consumption
This section details the energy usage and efficiency specifically for this facility.
| Field Name | Business Rules & Formula | Tooltip Content |
|---|---|---|
Energy Efficiency | - Value (e.g., 285 kWh/ML): Measures energy used per unit of output. - Formula: Total kWh Consumed ÷ Total Megaliters (ML) Produced. - Trend (e.g., ↓12 kWh/ML vs last month): A downward trend is positive, indicating improved efficiency. | Title : Energy Efficiency Description : Measures the energy consumed (kWh) to produce one megaliter of water. A lower number indicates better efficiency. |
Monthly Energy Cost | - Value (e.g., $18,650): Total energy cost for the current period. - Formula: SUM(kWh Consumed × Cost per kWh). - Trend (e.g., ↓8.2% vs budget): Compares actual cost against budget; under budget is positive. | Title : Monthly Energy Cost Description : The total cost of energy for this facility during the current period and variance versus planned budget. |
Energy Consumption by System | - Functionality: Ranked list of top energy-consuming systems within the facility. - Business Rules: Sorted descending by kWh consumption. Each row shows System Name, System ID, progress bar (% of total), and absolute kWh. Clicking a system opens detailed system view. | Title : Energy Consumption by System Description : Breakdown of energy usage by major operational systems, helping identify largest consumers for efficiency improvements. |
3. Section: Compliance & Water Quality
This section displays key regulatory and quality parameters for the water produced by this facility.
| Field Name | Business Rules & Formula | Tooltip Content |
|---|---|---|
Turbidity, Chlorine, pH, etc. fetched from compliance service order | - Functionality: A series of cards displaying key water quality parameters. - Business Rules: • Each card shows Parameter Name, latest reading, target/required range, and a status tag. • Status Tag colors and text are rule-based: – Within Limits (Green) if value is within target range. – Approaching Limit (Yellow) if near a boundary. – Exceeded (Red) if outside range. – “Normal” or “Compliant” are used for pass/fail tests. | Title : [Parameter Name] Description : The latest reading for [Parameter Name]. The target is [Target Range]. The current status is [Status]. |
4. Section: Asset Health & Financials
This section provides a snapshot of the physical and financial state of the assets within the facility.
| Field Name | Business Rules & Formula | Tooltip Content |
|---|---|---|
Asset Health Status Distribution | - Functionality: Breakdown of all assets in this facility by condition. - Shows count and percentage of assets in 'Good', 'Fair', and 'Poor' condition. - Formula: COUNT(Assets) WHERE Condition = '[Status]' and (Status Count / Total Assets) × 100. - Color legend consistent across the app. | Title : Asset Health Status Distribution Description : A breakdown of all assets by their assessed condition, helping visualize overall asset base health. |
Asset Age Profile | - Functionality: Breakdown of all assets by age bands (e.g., 0-5 years, 5-10 years). - Shows count per age band with progress bar for quick visual comparison. | Title : Asset Age Profile Description : A breakdown of all assets by age to assist long-term capital planning and replacement cycle understanding. |
Financial Overview | - Functionality: KPIs summarizing financial aspects of the facility. - Total Asset Value: SUM(Current Book Value) of all assets. - Maintenance Spend: SUM(Maintenance Costs) for current period. - Budget Variance: ((Budgeted Spend − Actual Spend) / Budgeted Spend) × 100. - Emergency Repairs: SUM(Costs) from 'Emergency' work orders. | Title : [Metric Name] Description : Detailed definitions of each financial metric as applicable to the facility. |
Assets Approaching Replacement | - Functionality: Watchlist of assets nearing end-of-life (e.g., Remaining Useful Life < 2 years). - Displays Asset Name, ID, Estimated Cost, Expected Replacement Quarter. - Priority tag (high/medium/low) based on criticality and risk. - "Schedule" button initiates capital planning or project workflow for asset replacement. | Title : Assets Approaching Replacement Description : Prioritized list of assets soon requiring replacement. 'Schedule' starts capital planning process. |
Frequent Failure Assets | - Functionality: Watchlist of most unreliable assets with highest failure-related work orders over last 6–12 months. - Displays Asset Name, ID, Failure Count, Last Failure Date. - "Inspect" button creates high-priority inspection work order. - "Review" button navigates to asset’s performance and maintenance history. | Title : Frequent Failure Assets Description : List of most unreliable assets, candidates for proactive overhaul or replacement. |
Alerts Tab
1. Section: Active Alerts
This is the primary section, divided into two main lists for critical issues and several KPI cards for urgent tasks.
1.1. Critical Assets Out of Service
- Functionality: A high-visibility list of the most important assets within this facility that are currently non-operational.
- Business Rules:
- An asset appears on this list if its
Statusis 'Out of Service' AND itsCriticalityrating is 'High' or 'Critical'. - Each list item must display:
- Asset Name: The common name of the asset (e.g., Secondary Pump).
- Asset ID: The unique identifier (e.g., P-003).
- Current Status: A brief, human-readable status of the repair effort (e.g., "Under Repair," "Parts Ordered," "Awaiting Technician"). This is likely pulled from the associated work order.
- ETA: The Estimated Time to Action/Resolution, pulled from the associated work order.
- View Button: Clicking this button must navigate user to respective service order.
- An asset appears on this list if its
- Tooltip Content: On hover over an asset: "This critical asset is currently down. The repair work order is [WO-XXXX] with a status of [Status].
1.2. Anomalies
- Functionality: A watchlist of assets exhibiting behavior outside of normal parameters, indicating a potential future failure.
- Business Rules:
- An alert is generated by a predictive analytics engine when an asset's sensor data (e.g., vibration, temperature, pressure) deviates from its established baseline.
- Each list item must display:
- Asset Name & ID: (e.g., Motor M-007).
- Detected Issue: A clear description of the anomaly (e.g., "Vibration levels high," "Temperature spike detected").
- Priority Tag: A priority (high, medium, low) assigned by the analytics engine based on the severity of the deviation and the calculated probability of failure.
- Time Since Detection: How long ago the anomaly was first detected (e.g., "5 min ago," "12 min ago").
- Investigate Button: Clicking this button must automatically generate a new "Investigation" type work order in the CMMS. The work order must be pre-populated with the asset ID, the anomaly description, and assigned to the appropriate engineering or maintenance team.
- Data Source: Service orders in which readings are more than the range (this could include compliance related issues also)
- Tooltip Content: On hover over an anomaly: "A potential failure has been detected on [Asset Name]. The system recommends creating an investigation work order to prevent a full failure."
1.3. Alert KPI Cards
These cards summarize urgent work items for the facility.
| Card Name | Business Rules & Formula | Tooltip Content |
|---|---|---|
Emergency Work Orders | - Value (e.g., 7): Count of all open work orders for this facility with priority 'Emergency' or 'Critical'. - Formula: COUNT(WOs) WHERE Facility_ID = [This Facility] AND Priority IN ('Emergency', 'Critical') AND Status = 'Open'. - Assign Resources Button : Opens resource scheduler pre-filtered to available technicians for emergency work in this facility. | Title : Emergency Work Orders Description : Number of open, high-priority work orders requiring immediate assignment. Click to dispatch a team. |
SLA Breaches | - Value (e.g., 3): Count of SLA breach events linked to this facility during the period. - Formula: COUNT(SLA_Breach_Events) WHERE Facility_ID = [This Facility]. - Escalate Button : Triggers escalation workflow notifying senior management and creates high-priority incident report on facility performance. | Title : SLA Breaches Description : Number of times Service Level Agreements were breached. Click 'Escalate' to start a formal review. |
Overdue Tasks | - Value (e.g., 12): Count of work orders past their due date and not completed. - Formula: COUNT(WOs) WHERE Facility_ID = [This Facility] AND Due_Date < Current_Date AND Status != 'Completed'. - View Details Button : Navigates to a filtered list of these overdue work orders. | Title : Overdue Tasks Description : Total work orders past scheduled due date. Click 'View Details' to take action. |
Work Order Backlog | - Value (e.g., 24 / Est. 156 hours): Number of open and scheduled work orders, plus total estimated labor hours to complete. - Formula (Count): COUNT(WOs) WHERE Facility_ID = [This Facility] AND Status IN ('Open', 'Scheduled'). - Formula (Hours): SUM(Estimated_Duration) for those work orders. - Optimize Schedule Button : Launches scheduling tool suggesting optimal work plan based on priority, resources, and asset location. | Title : Work Order Backlog Description : Summary of all pending work. Click 'Optimize Schedule' to use intelligent scheduling assistant. |
2. Section: Other Alert-Related Lists
These sections provide additional context on issues that are not necessarily emergencies but require strategic attention.
| List Name | Business Rules & Formula | Tooltip Content |
|---|---|---|
High Maintenance Cost Assets | - Functionality: Ranked list of assets with the highest maintenance costs. - Sorted descending by average monthly maintenance cost (labor, parts). - Each item shows Asset Name, ID, and monthly cost (in red to indicate negative impact). - Review Button : Navigates to detailed financial and maintenance history for analysis. | Title : High Maintenance Cost Assets Description : Assets driving the largest maintenance spend. Click 'Review' to analyze cost history. |
Predictive Maintenance Alerts | - Functionality: List of assets flagged by predictive models for upcoming maintenance. - Based on long-term degradation models (not immediate anomalies). - Each item shows Asset Name, ID, maintenance needed (e.g., bearing replacement), model confidence (e.g., 87%), and recommended timeframe (e.g., within 2 weeks). - Schedule Button : Opens "Create Service Order" form pre-filled with asset and task details. | Title : Predictive Maintenance Alerts Description : Assets predicted to require maintenance soon. Click 'Schedule' to create proactive work order. |
Active Violations | - Functionality: List of current unresolved compliance violations for this facility. - Each item shows Violation Type, status (e.g., PENDING, MONITOR), and resolution due date. - View Details Button : Navigates to detailed violation record in Compliance module. | Title : Active Violations Description : Current unresolved compliance violations. Click 'View Details' for full response plan. |
Overdue Inspections | - Functionality: List of mandatory asset inspections past their due date. - Sorted by priority and overdue duration. - Each item shows Asset Name, ID, priority tag (high/medium/low), and days overdue. - Schedule Button : Opens "Create Service Order" form as high-priority inspection task. | Title : Overdue Inspections Description : Mandatory inspections past due. Click 'Schedule' to create a work order immediately. |
Finance Tab
1. Section: Facility Book Value
This section provides a real-time snapshot of the facility's current valuation based on standard accounting principles.
| Field Name | Business Rules & Formula | Tooltip Content |
|---|---|---|
Current Book Value | - Value (e.g., $12,500,000): Net value on company books.- Formula: Initial Capital Cost - Accumulated Depreciation. | Title: Current Book Value Description: The accounting value of the facility, calculated as initial cost minus all depreciation to date. |
Initial Capital Cost | - Value (e.g., $25,000,000): Total acquisition or construction cost.- Static value entered during registration.- Only modifiable via a "Capital Improvement" event. | Title: Initial Capital Cost Description: The original total cost to acquire or build the facility, including all initial expenses. |
Accumulated Depreciation | - Value (e.g., ($12,500,000)): Sum of all depreciation charged since commissioning.- Displayed as negative (in red) to indicate value reduction.- Increases over time. | Title: Accumulated Depreciation Description: Total depreciation charged against the facility since it was placed in service. |
Salvage Value | - Value (e.g., $0): Estimated residual value at end of useful life.- Typically static, entered at registration. | Title: Salvage Value Description: Estimated resale value of the facility at end of its useful life; this amount is not depreciated. |
Calculate Finance Button | - Manual trigger to run next period's financial calculations.- On click: 1. Updates Accumulated Depreciation and Current Book Value. 3. Creates new entry in "Facility Financial History Ledger" with Event Type "Annual Depreciation" and Value Change. 4. Disabled if calculation for current period is done, showing tooltip "Depreciation for the current period has already been calculated." | Title: Calculate Finance Description: Manually triggers financial calculations for the next period (e.g., annual depreciation), updating values and ledger. |
2. Sub-Tab: Overview
This is the default view of the Finance tab, showing the depreciation schedule and a list of financially significant assets.
2.1. Facility Depreciation Schedule
| Field Name | Business Rules & Formula | Data Source | Tooltip Content |
|---|---|---|---|
Annual Depreciation (Current Year) | - Value (e.g., $500,000): Depreciation expense for the current fiscal year.- Formula: (Initial Capital Cost - Salvage Value) / Design Useful Life (Years) | Calculated field | Title: Annual Depreciation Description: The calculated depreciation expense for this facility for the current fiscal year. |
Depreciation To Date (Current Year) | - Value (e.g., $250,000): Portion of the current year's depreciation recognized so far.- Formula: Annual Depreciation × (Months Passed in Fiscal Year / 12) | Calculated field | Title: Depreciation To Date Description: The portion of this year's depreciation accounted for as of today's date. |
Remaining Depreciation | - Value (e.g., $12,500,000): Total depreciation yet to be charged over the remaining life.- Formula: Current Book Value - Salvage Value | Calculated field | Title: Remaining Depreciation Description: The amount of value yet to be depreciated over the facility's remaining life. |
Next Depreciation Date | - Value (e.g., Dec 31, 2025): Date of the next scheduled major depreciation event.- Usually the end of the fiscal year. | Calculated based on last depreciation event date | Title: Next Depreciation Date Description: The date the next annual depreciation expense will be officially recorded. |
2.2. Assets Nearing End-of-Life
- Functionality: A watchlist of assets within this facility that have a significant financial impact and are approaching their replacement date.
- Business Rules:
- This list is filtered for assets with a
Remaining Lifeof less than 5 years. - The list is sorted by
Remaining Lifein ascending order. - Each item must display:
- Asset Name & ID: (e.g., High-Service Pump P-301).
- Remaining Life: Displayed with a color-coded tag based on urgency (e.g., <3 years = Red, 3-4 years = Yellow).
- Current Book Value: The current accounting value of that specific asset.
- Est. Replacement Cost: The estimated capital cost to replace that specific asset.
- This list is filtered for assets with a
- Data Source: The Asset Registry, filtered for assets belonging to this facility.
- Tooltip Content: On hover over an asset: "This asset is nearing its end-of-life. Its replacement will require an estimated capital expenditure of [Est. Replacement Cost]. This information is critical for long-term capital planning."
3. Sub-Tab: History
This sub-tab provides a detailed, auditable log of all financial events that have affected the facility's book value.
3.1. Filters
| Filter Name | Business Rules |
|---|---|
View: | - Dropdown to filter the ledger by time. - Options: "All Years," "Last 5 Years," "Last 12 Months," or a specific year (e.g., "2024," "2023"). - Default selection is "All Years." |
Event Type: | - Multi-select dropdown to filter by financial event type. - Options: "All Events," "Annual Depreciation," "Capital Improvement," "Revaluation," "Impairment." - Default is "All Events." |
3.2. Facility Financial History Ledger
- Functionality: A chronological, read-only table that acts as an audit trail for the facility's book value.
- Business Rules:
- The table is sorted by Effective Date in descending order (most recent event first).
- A new row is added to this ledger every time the "Calculate Finance" button is clicked or when another significant financial event (like a capital improvement) is logged.
- Value Change is color-coded: Red for decreases (depreciation) and Green for increases (capital improvements).
- Table Columns:
- Effective Date: The date the financial event was recorded.
- Event Type: The nature of the event (e.g., Annual Depreciation, Capital Improvement).
- Value Change: The amount by which the book value changed due to this event.
- Book Value at End of Period: The resulting book value after this event occurred.
- Notes: A brief, human-readable description of the event.
Compliance Tab
1. Section: Compliance Summary KPIs
This section provides a high-level, at-a-glance summary of the facility's current compliance standing.
| KPI Card | Field Name / Element | Business Rules & Formula | Tooltip Content |
|---|---|---|---|
Compliance Status | Overall Status: "On Schedule" | A calculated status. If Next Sample Due is not past and all previous samples were taken, status is "On Schedule." If a due date is missed, status becomes "Overdue" (Red). | Title: Compliance Status Description: Indicates if the facility is on track with its mandatory sampling schedule. |
Samples Taken (This Month): 10 | COUNT(Samples) where Sample_Date is in the current month for this facility. | Title: Samples Taken Description: The total number of regulatory samples collected and analyzed for this facility so far this month. | |
Next Sample Due: July 15, 2025 | The earliest Due_Date for any upcoming scheduled sample for this facility. | Title: Next Sample Due Description: The due date for the next required regulatory sample. | |
View Full Schedule Button | Navigates to a dedicated, detailed page showing the complete annual sampling schedule for this facility. | N/A | |
Water Quality Compliance | Overall Status: "In Compliance" | A calculated status. If Exceedances (Last 30 Days) is 0, status is "In Compliance." If > 0, status is "Violation Detected" (Red). | Title: Water Quality Compliance Description: Indicates if all water quality parameters are currently within their regulatory limits. |
Parameters Monitored: 0 | COUNT(DISTINCT Parameter) for all monitored parameters for this facility. | Title: Parameters Monitored Description: The total number of distinct water quality parameters being monitored for this facility. | |
Exceedances (Last 30 Days): 0 | COUNT(Samples) where Result is outside the regulatory limit and Sample_Date is within the last 30 days. | Title: Recent Exceedances Description: The number of times a sample has tested outside of its regulatory limits in the last 30 days. | |
View Recent Results Button | Navigates to a detailed log of all recent sample results for this facility. | N/A |
2. Sub-Tab: Overview
This is the default view, showing upcoming activities and current readings.
2.1. Calculate Monthly Compliance Button
- Functionality: This is a key user action that manually triggers the generation of a formal monthly compliance report.
- Business Rules:
- When clicked, the system gathers all sample data for the specified analysis period (e.g., the previous month).
- It calculates the monthly average for each parameter.
- It identifies all violations (exceedances) that occurred during that period.
- It compiles this information into a structured report format (as seen in the "Monthly Average Quality Parameters" screenshot).
- Crucially, it creates a new, permanent entry in the "Compliance Calculation History" ledger (visible on the History sub-tab). This entry includes the report date, analysis period, counts of parameters, and violations.
- The button could be disabled if the report for the most recent full month has already been generated, with a tooltip explaining this.
2.2. Upcoming Parameter Monitoring Table
- Functionality: A schedule of the next required sampling activities for this facility.
- Business Rules:
- The table lists all parameters that have a scheduled sample due in the near future (e.g., next 30 days).
- The list is sorted by Next Due Date.
- Status Column: Displays a color-coded tag. "Upcoming" (Yellow) for future dates. If the due date were today, it could be "Due Today" (Orange). If it were past, it would be "Overdue" (Red).
2.3. Latest Parameter Readings vs. Standards Table
- Functionality: A snapshot of the most recent test result for key parameters against their official regulatory limits.
- Business Rules:
- For each key parameter, it shows the most recent
Last Reading. - Status Column: A calculated, color-coded tag. "In Compliance" (Green) if the reading is within the guideline. "Exceeded" (Red) if it is not.
- For each key parameter, it shows the most recent
- Data Source: LIMS, cross-referenced with a master table of regulatory standards.
3. Sub-Tab: History
This sub-tab provides an auditable trail of all generated monthly compliance reports.
3.1. Compliance Calculation History Ledger
- Functionality: A read-only table that acts as an audit trail for all formally calculated compliance reports.
- Business Rules:
- The table is sorted by Report Date in descending order.
- A new row is added to this ledger every time the "Calculate Monthly Compliance" button is clicked.
- The
Violationscolumn is highlighted in red if the count is greater than zero, drawing immediate attention to past issues.
- Table Columns:
- Report Date: The date the "Calculate" button was clicked and the report was generated.
- Analysis Period: The time frame the report covers (e.g., June 1 - June 30, 2025).
- Parameters Monitored: A count of distinct parameters included in that month's report.
- In Compliance: A count of the parameters that were fully in compliance for the entire period.
- Violations: A count of the parameters that had at least one violation during the period.
- Assessed By: The name of the user who was logged in and clicked the "Calculate" button.
- Actions (View Report Button): Clicking this button navigates the user to the detailed monthly report view for that specific historical period.
3.2. Detailed Monthly Report View (Navigated to from History)
- Functionality: This is the detailed, static report that was generated for a specific historical period.
- Business Rules:
- This is a read-only view. The data is frozen as of the time of calculation.
- It contains two main tables:
- Monthly Average Quality Parameters: Shows the calculated average for each parameter over the analysis period, compared against the guideline.
- Violations: A specific list of every individual sample that exceeded its limit during that period. This table must include the
Parameter, the exactValue Recorded, theSNDWS Guidelineat the time, theDate of Violation, and aSeveritytag (High, Moderate) based on the degree of exceedance.
- A "Back to Overview" or "Back to History" button allows the user to return to the main compliance history ledger.
Systems Tab
1. Systems Management List View (Main Screen)
This is the default view of the Systems tab.
1.1. Header & Actions
| Element | Business Rules & Functionality |
|---|---|
Title (Systems Management) | A clear title for the section. |
Subtitle | "Manage and monitor all systems within this facility." |
Add System Button | - Primary call-to-action to associate a new system with this facility. - Clicking opens the "System Suggestions" modal as the first step. - This modal intelligently helps the user quickly find and connect relevant systems. |
1.2. Search & Filter Bar
| Element | Business Rules & Functionality |
|---|---|
Search systems... | - Free-text search box. - Dynamically filters the systems list as the user types. - Matches on System ID or Name , case-insensitive. |
Filter Button | - Opens a dropdown or modal with advanced filtering options. - Filter options include: • Location (multi-select checklist) • Condition Score (slider/range input) • Risk Score (slider/range input) - Applying filters updates the displayed systems. |
Export Button | - Exports the currently displayed list of systems. - Generates CSV or Excel respecting active search/filter criteria. |
1.3. Systems List Table
- Functionality: A table listing all systems currently associated with this facility.
- Business Rules:
- The table is paginated if the number of systems exceeds the display limit (e.g., 10 per page).
- Each column is sortable by clicking the header.
- Table Columns:
- System ID: The unique identifier for the system (e.g., SYS-001). Clicking this ID navigates to the detailed profile page for that specific system.
- Name: The common name of the system (e.g., Water Treatment Plant A).
- Location: The physical location of the system within the facility.
- Assets: The total count of individual assets that belong to this system. Formula:
COUNT(Assets) WHERE Parent_System_ID = [This System_ID]. - Condition Score: The aggregated health score of the system, calculated from its child assets. Displayed with a color-coded tag (e.g., 85=Good, 72=Fair, 68=Fair).
- Risk Score: The aggregated risk score of the system. Displayed with a color-coded tag.
- Actions: A set of inline actions for each system record:
- View: Navigates to the detailed profile page for that system.
- Edit: Opens a form or modal to edit the details of that system.
- Delete: This action disconnects the system from the facility, it does not delete the system record itself. A confirmation modal must appear stating, "Are you sure you want to remove this system from the facility? This will not delete the system record."
2. "System Suggestions" Modal (First Modal)
This modal appears when the user clicks "Add System." It intelligently suggests systems to connect.
- Functionality: To streamline the process by presenting the most likely systems the user wants to connect, based on a set of rules.
- Business Rules:
- The system runs a query to find unassigned systems or systems that are likely candidates based on logic.
- Each suggestion card must display:
- System Name & ID: The primary identifiers.
- Reason: A clear, human-readable explanation for why the system is being suggested. This is the core of the intelligent feature.
- Reason Types: "Standard for [Facility Type]," "Common in [Facility Type]," "Located within this facility's service area," "Geographic proximity to facility location. if other facility with same type exists and it consists of systems types and if this facility does not have same system types then recommend those system types or systems in the same area as the facility"
- Type Tag: A tag indicating the system's classification (e.g., Disinfection, Treatment, Pumping).
- Checkbox: Allows the user to select one or more suggestions to connect.
- Modal Actions:
- Connect Selected Suggestions (X) Button:
- The number in parentheses
(X)must dynamically update as the user checks/unchecks suggestions. - The button is disabled if no systems are selected (
X=0). - When clicked, the selected systems are immediately associated with the facility in the background, the modal closes, and the main "Systems Management" list refreshes to show the newly added systems.
- The number in parentheses
- Skip and Search All Systems Button:
- If the user doesn't find what they need in the suggestions, this button closes the "Suggestions" modal and opens the "Connect Systems" modal, which provides a full search interface.
- Cancel Button: Closes the modal and returns the user to the Systems Management list view without making any changes.
- Connect Selected Suggestions (X) Button:
3. "Connect Systems to..." Modal (Second Modal)
This modal appears if the user clicks "Skip and Search All Systems." It provides a comprehensive search and selection interface.
- Functionality: To allow the user to find and connect any available, unassigned system in the entire registry.
- Business Rules:
- The list displays all systems where
Parent_Facility_IDis null or unassigned. - Search Bar: Filters the list of available systems by Name, ID, or Location as the user types.
- Filter Dropdowns:
- All Types: Filters the list by system classification (e.g., Filtration, Disinfection, Pumping).
- All Statuses: Filters the list by operational status (e.g., Operational, Standby, Inactive).
- Available Systems List:
- Each item is selectable via a checkbox.
- Each item displays the System Name, ID, Location, current assignment status ("Unassigned"), a type tag, and a status tag.
- The list displays all systems where
- Modal Actions:
- Connect Selected (X) Button:
- The number
(X)dynamically updates based on user selections. - The button is disabled if no systems are selected.
- When clicked, the selected systems are associated with the facility, the modal closes, and the main list view refreshes.
- The number
- Cancel Button: Closes the modal without making changes.
- Connect Selected (X) Button:
Networks Tab
1. Networks Management List View (Main Screen)
This is the default view of the Networks tab.
1.1. Header & Actions
| Element | Business Rules & Functionality |
|---|---|
Title (Networks Management) | A clear title for the section. |
Subtitle | "Monitor and manage distribution networks and transmission lines." |
Add Network Button | - Primary call-to-action to associate a new network with the facility. - Clicking opens the "Network Suggestions" modal to help users find and connect relevant networks easily. |
1.2. Search & Filter Bar
| Element | Business Rules & Functionality |
|---|---|
Search networks... | - Free-text search box. - Dynamically filters the list of networks as the user types, matching
or
(case-insensitive). |
Filter Button | - Opens a dropdown or modal with advanced filter options. - Filter options include: • Parent System: multi-select checklist of systems within this facility. • Condition Score: slider or range input (e.g., 70-90). • Network Length: range input (e.g., 5-10 km). - Applying filters updates the networks list shown. |
Export Button | - Exports the currently displayed list of networks to CSV/Excel. - Export respects active search terms and filter criteria. |
1.3. Networks List Table
- Functionality: A table listing all networks currently associated with this facility.
- Business Rules:
- The table is paginated if the number of networks exceeds the display limit.
- Each column is sortable by clicking the header.
- Table Columns:
- Network ID: The unique identifier for the network (e.g., NET-001). Clicking this ID navigates to the detailed profile page for that specific network.
- Name: The common name of the network (e.g., Primary Distribution Network).
- Parent System: The ID of the system within the facility that this network is directly connected to or fed by. This establishes a clear hierarchical link.
- Assets: The total count of individual assets (pipes, valves, hydrants) that make up this network. Formula:
COUNT(Assets) WHERE Parent_Network_ID = [This Network_ID]. - Network Length: The total geographical length of the network. Formula:
SUM(Length)of all pipe assets within the network. Displayed in km or miles. - Condition Score: The aggregated health score of the network, calculated from its child assets. Displayed with a color-coded tag (e.g., 78=Good, 72=Fair, 91=Good).
- Actions: A "kebab" menu (
...) that opens a dropdown of actions for that specific network record. The options would be similar to the Systems tab: View, Edit, and Delete (which disconnects the network from the facility).
2. "Network Suggestions" Modal
This modal appears when the user clicks "Add Network." It intelligently suggests networks to connect based on location and service area.
- Functionality: To streamline the process by presenting the most likely networks the user wants to connect.
- Business Rules:
- The system runs a query to find unassigned networks that fall within or are adjacent to the facility's defined service zones.
- Each suggestion card must display:
- Network Name: The primary identifier.
- Reason: A clear, location-based explanation for the suggestion. This is the core intelligent feature.
- Reason Examples: "Serves the 'Industrial Park Zone', which is part of the 'Northern Division'," "Serves the 'Hillside Zone', which is part of the 'Northern Division'."
- Type Tag: A tag indicating the network's classification (e.g., Water Main, Sewer Main).
- Checkbox: Allows the user to select one or more suggestions to connect.
- Modal Actions:
- Connect Selected (X) Button:
- The number in parentheses
(X)must dynamically update as the user checks/unchecks suggestions. - The button is disabled if no networks are selected (
X=0). - When clicked, the selected networks are associated with the facility, the modal closes, and the main "Networks Management" list refreshes.
- The number in parentheses
- Skip and Search All Networks Button:
- If the user doesn't find what they need, this button closes the "Suggestions" modal and opens the "Connect Networks" modal, which provides a full search interface.
- Cancel Button: Closes the modal without making any changes.
- Connect Selected (X) Button:
3. "Connect Networks to..." Modal (Search & Filter)
This modal appears if the user clicks "Skip and Search All Networks." It provides a comprehensive search and selection interface.
- Functionality: To allow the user to find and connect any available, unassigned network from the entire registry.
- Business Rules:
- The list displays all networks that are not currently associated with any facility.
- Search Bar: Filters the list of available networks by Name, ID, or the Zone it serves as the user types.
- Filter Dropdowns:
- All Types: Filters the list by network classification (e.g., Water Main, Sewer Main, Transmission Line).
- All Statuses: Filters the list by operational status (e.g., Active, Inactive, Under Construction).
- Available Networks List:
- Each item is selectable via a checkbox.
- Each item displays the Network Name, ID, the Zone it serves, its current assignment status ("Unassigned"), a type tag, and a status tag.
- Modal Actions:
- Connect Selected (X) Button:
- The number
(X)dynamically updates based on user selections. - The button is disabled if no networks are selected.
- When clicked, the selected networks are associated with the facility, the modal closes, and the main list view refreshes.
- The number
- Cancel Button: Closes the modal without making changes.
- Connect Selected (X) Button:
Condition and Risks Tab
1. Section: Top-Level Scores
This section displays the highest-level condition and risk scores for the entire facility.
| KPI Card | Field Name / Element | Business Rules & Formula | Data Source | Tooltip Content |
|---|---|---|---|---|
Facility Condition | Score (82) | - Current official condition score for the facility. - Status Tag: color-coded qualitative status based on score range: Poor (0-40), Fair (41-75), Good (76-100). | Most recent "Condition" assessment from Assessment History ledger. | Title: Facility Condition Score Description: The overall health score of this facility, aggregated from its systems and assets. |
Last Assessed: June 15, 2025 | Date of most recent condition assessment. | Assessment History ledger | Title: Last Assessed Date Description: The date the current condition score was officially recorded. | |
Assessed By: Jane Smith (Operations) | Name and department of the user who performed the last assessment. | Assessment History ledger | Title: Assessed By Description: The user or team that performed the most recent condition assessment. | |
Assess Condition Button | - Initiates a new condition assessment workflow. - Opens a new screen or modal for authorized users to input data and calculate new score. - On completion, creates a new history ledger entry. | N/A | N/A | |
Facility Risk | Score (65) | - Current official risk score for the facility. - Status Tag: color-coded qualitative status based on score range: Low (0-30), Medium (31-70), High (71-100). | Most recent "Risk" assessment from Assessment History ledger. | Title: Facility Risk Score Description: A score representing the overall risk posed by this facility, combining likelihood and consequence of failure. |
Last Assessed: May 30, 2025 | Date of most recent risk assessment. | Assessment History ledger | Title: Last Assessed Date Description: The date the current risk score was officially recorded. | |
Assessed By: Jane Doe (Engineering) | Name and department of the user who performed the last assessment. | Assessment History ledger | Title: Assessed By Description: The user or team that performed the most recent risk assessment. | |
Assess Risk Button | - Initiates a new risk assessment workflow. - Opens a workflow for authorized users to calculate a new risk score. - Creates a new entry in the history ledger on completion. | N/A | N/A |
2. Sub-Tab: Overview
This is the default view, designed to immediately draw the user's attention to the worst-performing and highest-risk components within the facility.
2.1. Watchlists
- Functionality: This section contains four "watchlist" tables that act as dynamically generated "Top X" lists for problem areas.
- Business Rules:
- Each table displays a filtered and sorted list of either Systems or Assets belonging to the current facility.
- The lists are limited to showing the top 3-5 items to keep the view concise. A "View All" button could be added to navigate to a full, sortable list.
- Actions (
...): The kebab menu for each item would provide quick links, such as "View Details" (navigates to the item's profile), "Create Service Order," or "Schedule Inspection."
| Watchlist Table | Sorting & Filtering Logic |
|---|---|
Systems with Lowest Condition | Filter: All Systems belonging to this facility.Sort: By Condition Score in ascending order (worst first). |
Systems with Highest Risk | Filter: All Systems belonging to this facility.Sort: By Risk Score in descending order (riskiest first). |
Assets in Poor Condition | Filter: All Assets belonging to this facility where Condition_Status is 'Poor'.Sort: By Condition Score ascending. |
Assets with Highest Risk | Filter: All Assets belonging to this facility where Risk_Status is 'High'.Sort: By Risk Score in descending order. |
3. Sub-Tab: History
This sub-tab provides a complete, auditable log of all condition and risk assessments performed on the facility.
3.1. Filters
| Filter Name | Business Rules |
|---|---|
Score Type | Dropdown filter for assessment type. Options: "All Assessments," "Condition," "Risk." Default: "All Assessments." |
Assessed By | Searchable dropdown filter for the user who performed the assessment. Populated with all past assessors of the facility. Default: "All Users." |
Start Date / End Date | Two date pickers to filter the assessment history ledger within a specific date range. |
3.2. Assessment History Ledger
- Functionality: A chronological, read-only table that acts as an audit trail for the facility's condition and risk scores.
- Business Rules:
- The table is sorted by Assessment Date in descending order (most recent first).
- A new row is added to this ledger every time a user completes an "Assess Condition" or "Assess Risk" workflow.
- Table Columns:
- Assessment Date: The date the assessment was officially recorded.
- Score Type: The type of assessment performed ("Condition" or "Risk").
- Score: The numerical score that was calculated.
- Status: The qualitative, color-coded tag corresponding to the score.
- Assessed By: The name and department of the user who performed the assessment.
Schedules Tab
1. Section: PM Schedules Header
| Element | Business Rules |
|---|---|
Title (PM Schedules) | A clear title for the section. |
Subtitle | "Preventive maintenance and inspection schedules for this facility." |
Create Schedule Button | - Primary call-to-action for creating a new recurring maintenance schedule. - Clicking opens a multi-step wizard where users define schedule name, type, frequency, applicable assets, and tasks. |
Manage Schedules Button | - Navigates to an advanced management interface. - This may include calendar views of schedules, bulk activate/deactivate tools, or advanced configuration for work order generation. |
2. Section: Scheduled Activities Table
This table is the main component of the screen, listing all active and overdue maintenance schedules for the facility.
| Column Name | Business Rules & Formula | Tooltip Content |
|---|---|---|
Schedule ID | Unique identifier for the master schedule (e.g., PM-PUMP-001). Primary key for the schedule. | Title: Schedule ID Description: The unique identifier for this recurring maintenance schedule. |
Schedule Name | Human-readable descriptive name for the schedule (e.g., "Monthly Pump Inspection - Station 3"). | Title: Schedule Name Description: A descriptive name for this maintenance plan. |
Type | Classification of the schedule with color-coded tag. Options: "Preventive Maintenance," "Inspection" from predefined list in Settings. | Title: Schedule Type Description: The classification of this schedule, determining the type of work orders generated. |
Frequency | Trigger for next work order generation. Can be time-based (Monthly, Quarterly, Annually) or usage-based (e.g., Every 500 Hours). Usage-based requires integration with asset telemetry (SCADA/IoT). | Title: Frequency Description: The trigger for generating the next work order, based on time or asset usage. |
Runs | Total number of times this schedule’s maintenance has been performed (count of completed work orders linked to Schedule_ID). | Title: Runs Description: The total number of times this scheduled maintenance has been successfully completed. |
Assets | Number of individual assets included in this maintenance schedule. One schedule can cover multiple assets (e.g., 5 pumps in a station). | Title: Assets Covered Description: The number of individual assets included in this recurring schedule. |
Next Due Date | Date when the next work order is due, calculated as Last Completed date + Frequency (e.g., June 15 + Monthly = July 15). | Title: Next Due Date Description: The date the next work order generated by this schedule is due. |
Last Completed | Completion date of the most recent work order generated by this schedule. | Title: Last Completed Date Description: The date the most recent maintenance cycle for this schedule was completed. |
Progress | Completion progress of the current cycle: (Number of Assets Completed / Total Assets in Schedule). For example, 3/5 completed for 5 assets. | Title: Progress Description: The completion progress for the current maintenance cycle, especially for multiple assets. |
Status | Overall schedule status, shown as a color-coded tag: • Active (Green): Running normally. • Overdue (Red): Next Due Date passed and work order not complete. • Ina |
O&M Tab
2. Section: Service Orders List View
This is the main component of the O&M tab.
2.1. Search & Filter Bar
| Element | Business Rules |
|---|---|
Search service orders... | - A free-text search input box. - Dynamically filters the visible list of service orders as the user types. - Matches if the search term (case-insensitive) appears in Service Order ID , Service Order Name , or Asset Name / ID fields. |
Filter Button | - Opens a dropdown or modal with advanced filtering options. - Filter options include: • Type : Multi-select checklist with options like Preventive, Corrective, Inspection, Emergency. • Priority : Multi-select checklist with High, Medium, Low, Critical. • Status : Multi-select checklist including In Progress, Completed, Scheduled, Active, On Hold. • Date Range : Start and end date pickers to filter by creation or due date. - Applying any filters updates the service orders list accordingly. |
Export Button | - Exports the currently displayed service orders list (after any applied search and filters). - Generates a CSV or Excel file reflecting the current list view. |
2.2. Service Orders Table
- Functionality: A table listing all service orders associated with this facility.
- Business Rules:
- The table is paginated if the number of service orders exceeds the display limit (e.g., 10 per page).
- Each column is sortable by clicking the header.
- Table Columns:
| Column Name | Business Rules & Formula | Data Source | Tooltip Content |
|---|---|---|---|
SO ID | - Unique, system-generated identifier for each service order (e.g., SO-001). - Primary key for the service order. | Service Order table | Title: Service Order ID Description: The unique identifier for this work order. |
SO Name | - Human-readable name describing the main task (e.g., "Pump Maintenance," "Filter Replacement"). | Service Order table | Title: Service Order Name Description: A brief description of the work to be performed. |
Asset Name / ID | - Displays the asset’s common name and unique ID. - Linked to the Asset Registry for more details. | Asset Registry | Title: Target Asset Description: The specific asset that is the subject of this service order. |
System / Network | - Shows the parent System or Network the asset belongs to, providing hierarchical context. - Linked to System/Network Registry for details. | System/Network Registry | Title: Parent System/Network Description: The parent system or network that this asset belongs to. |
Location | - Physical location of the asset where work is to be performed (e.g., "Building A-1," "Treatment Plant"). - Pulled from the asset’s location attribute. | Asset location attribute | Title: Location Description: The physical location of the asset where the work will take place. |
Type | - Classification of the work order. - Options (Preventive, Corrective, Inspection) come from a pre-defined list in Settings. | Service Order table | Title: Service Order Type Description: The classification of this work (planned preventive, corrective, etc.). |
Priority | - Urgency of the service order. - Displayed as a color-coded tag (High=Red, Medium=Yellow, Low=Green). - Priority levels managed in Settings. | Service Order table | Title: Priority Description: The urgency of this work order, influencing scheduling and resource allocation. |
Status | - Current lifecycle stage of the service order. - Displayed as a color-coded tag. - Status options (In Progress, Completed, Scheduled, Active) are managed by the workflow engine. - "Active" means open but not started yet. | Service Order table | Title: Status Description: The current stage of this service order in its lifecycle. |
Actions | - Primary action: "View" navigates to detailed service order page. - Additional actions (Edit, Cancel) appear in a dropdown depending on permissions and SO status. | N/A | Title: Actions Description: View the full details of this service order. |
1. Section: Files & Documents Header
| Element | Business Rules |
|---|---|
Title (Files & Documents) | A clear and prominent title for this section, such as "Files & Documents". |
Subtitle | Text below the title: "Manage facility-related documents, media files, and attachments." |
Upload Files Button | - Primary call-to-action button to add new files to the facility’s document library. - On click, opens the operating system’s native file selection dialog allowing multi-file selection. - After files are selected, show a progress indicator for each upload. - Enforce file restrictions: allowed file types (e.g., pdf, jpg, png, docx) and maximum file size per file. - Provide user feedback on upload success/failure per file. |
2. Section: File Categorization
- Functionality: The screen automatically categorizes uploaded files into logical groups to improve organization and usability.
- Business Rules:
- The categorization is based on the file's MIME type or file extension upon upload.
- Media Files: This section contains visual and audio-visual files.
- Rule: Files with extensions like
.jpg,.jpeg,.png,.gif,.mp4,.mov,.aviare automatically placed here.
- Rule: Files with extensions like
- Documents: This section contains standard business and technical documents.
- Rule: Files with extensions like
.pdf,.docx,.doc,.xlsx,.xls,.pptx,.txtare automatically placed here.
- Rule: Files with extensions like
- Other Categories (Not Shown but Implied): The system could have other categories like "Drawings" (
.dwg,.dxf) or "Other" for miscellaneous file types.
3. Section: File Card (Core Component)
Each file is represented by a card containing its metadata and available actions.
| Element / Field | Business Rules & Formula | Data Source | Tooltip Content |
|---|---|---|---|
File Name | - Displays the file name including extension (e.g., facility_overview.jpg). - Clicking the name opens the file in-browser if supported (PDF, JPG) or downloads it otherwise. | File metadata table | Title: File Name Description: Click to open or download the file. |
File Size | - Shows the size in KB, MB, or GB by converting raw bytes to most readable unit. | File metadata table | Title: File Size Description: The storage size of this file. |
Uploaded By | - Shows the uploader’s name linked via User Directory. | File metadata table linked to User Directory | Title: Uploaded By Description: The user who originally uploaded this file. |
Upload Date | - Shows the date when the file was uploaded. | File metadata table | Title: Upload Date Description: The date this file was added to the facility's document library. |
Download Icon (↓) | - Clicking initiates a direct download of the file to the user’s device. | N/A | Title: Download File Description: Click to download this file to your device. |
Preview Icon (👁️) | - Opens a preview in modal or new tab for browser-supported file types (PDF, images, text, some videos). - Disabled or hidden for unsupported types (e.g., .xlsx, .dwg), with tooltip "Preview not available for this file type." | N/A | Title: Preview File Description: Click to open a preview of this file without downloading. |
More Actions (...) | - Opens a dropdown with actions: • Edit Details (rename, add description) • Move (re-associate to different entity) • View History (access/version log) • Delete (with confirmation modal: "Are you sure you want to permanently delete this file? This action cannot be undone.") | N/A | Title: More Actions Description: View more options for this file. |
Notes Tab
1. Section: Notes & Comments Header
| Element | Business Rules |
|---|---|
Title (Notes & Comments) | A clear title for the section. |
Subtitle | "Add and view notes related to this facility." |
Export Button | - Functionality: Exports the currently displayed list of notes. - Business Rule: Clicking triggers generation and download of a CSV or TXT file. - The exported file respects active search/filter criteria and includes note content, creator, and timestamps. |
2. Section: Add a New Note
This is the primary input area for creating new notes.
| Element | Business Rules |
|---|---|
Text Area (Add a new note...) | - Multi-line input field for composing a note. - Supports up to ~1000 characters. - Supports basic markdown formatting (bold, italics, lists) which will render in the display view. |
Add Note Button | - Submits the content of the text area as a new note. - Disabled if the text area is empty. - On click, creates a new record in the Notes table with: • Note_Content = text area content • Facility_ID = current facility ID • Created_By = current logged-in user ID • Created_At = current server timestamp - After submission, clears the text area and prepends the new note to the top of the notes list. |
3. Section: Notes List
This section displays all historical notes for the facility in a chronological feed.
3.1. Search & Filter Bar
| Element | Business Rules |
|---|---|
Search notes... | - Free-text search box. - Dynamically filters the notes list as the user types. - Matches search term against note content and creator’s name. |
Filter Button | - Opens a dropdown or modal with advanced filtering options. - Filter Options: • Created By: searchable dropdown listing all users who have created notes for this facility. • Date Range: start and end date pickers for filtering by creation date. - Applying filters updates the displayed notes list immediately. |
3.2. Individual Note Display
- Functionality: Each note is displayed as a separate item in a list.
- Business Rules:
- The list must be sorted chronologically, with the most recent note appearing at the top.
- Each note item must display:
- Note Content: The full text of the note.
- Metadata Line: A line of text below the content showing who created it and when.
- Formula: "Created by: [User Name] on [YYYY-MM-DD HH:MM]"
- Updated Metadata (Conditional): If a note has been edited, an additional line must appear.
- Formula: "Updated by: [Editor's Name] on [YYYY-MM-DD HH:MM]"
- This line only appears if the
Updated_Attimestamp is different from theCreated_Attimestamp.
- Edit Icon (
✎): An icon that allows for editing the note.- Business Rule: This icon is only visible to the original author or an administrator. Clicking it would make the note's text content editable in-place or open an editing modal. Saving the edit updates the
Note_Contentand sets theUpdated_ByandUpdated_Atfields.
- Business Rule: This icon is only visible to the original author or an administrator. Clicking it would make the note's text content editable in-place or open an editing modal. Saving the edit updates the
- Tooltip Content:
- On hover over the creator's name: Could show additional user details like their role or department.
- On hover over the Edit icon: "Edit this note (only available to the original author)."
Activity Log
1. Section: Activity Log Header
| Element | Business Rules |
|---|---|
Title (Activity Log) | A clear, prominent title for the section. |
Subtitle | "Timeline of all activities and changes for this facility." |
Export Button | - When clicked, exports the currently displayed activity log. - Generates a CSV or plain text file. - Export respects any active search or filter criteria applied to the log. - Export includes columns: Event Type, Timestamp, Description, and Associated User/System. |
2. Section: Activity Feed
This is the main component, displaying the chronological list of all activities.
2.1. Search & Filter Bar
| Element | Business Rules |
|---|---|
Search activities... | - Free-text search input. - Dynamically filters the activity log as the user types. - Matches entries where either the description or the associated user/system name contains the search term (case-insensitive). |
Filter Button | - Opens a dropdown or modal with advanced filtering options. - Filter Options: • Activity Type: Multi-select checklist of all event types (e.g., Service Order, Inspection, Failure, Maintenance, Compliance, Note Added, Asset Created). • User / Source: Searchable dropdown listing all users and system sources (e.g., "John Smith," "System Alert," "Compliance Engine"). • Date Range: Start and end date pickers to filter entries by timestamp. - Applying any filter immediately updates the visible activity log entries accordingly. |
2.2. Individual Activity Log Entry (Core Component)
- Functionality: Each significant event is displayed as a distinct item in a chronological list.
- Business Rules:
- The list must be sorted in reverse chronological order, with the most recent activity at the top.
- Each entry is composed of several key pieces of metadata, which are dynamically pulled from the source event.
| Element / Field | Business Rules & Formula | Tooltip Content |
|---|---|---|
Activity Type Tag | - Color-coded tag indicating event category.- Colors and text by event type: • Service Order (Blue) • Inspection (Green) • Failure (Red) • Maintenance (Purple) • Compliance (Orange) • Note (Gray) | Title: Activity Type Description: The category of this log entry, based on where the event originated in the system. |
Timestamp | - Exact date and time the event occurred.- Format: YYYY-MM-DD HH:MM | Title: Event Timestamp Description: The exact date and time this activity was recorded in the system. |
Primary Description | - Bold concise summary string generated by the system.- Examples: • Service Order: "Created service order SO-001 for pump maintenance" • Failure Alert: "Reported failure in control valve C3" | Title: Activity Summary Description: A high-level summary of the event that occurred. |
Secondary Description | - Optional non-bold line with additional details.- Pulled from related event data.- Examples: • Service Order: "Scheduled preventive maintenance for main pump unit" • Inspection: "All parameters within acceptable ranges" | Title: Additional Details Description: More specific details about this activity. |
User / Source | - Shows the responsible user or system/process.- If user performed the action, show full user name (e.g., "John Smith").- If automated, show system name (e.g., "System Alert," "Compliance Engine"). | Title: Event Source Description: The user or system process that generated this activity log entry. |
Clickable Entry | - Entire row is clickable.- Clicking navigates to the source record based on
and
.- Examples: • Clicking a service order entry opens the detailed service order page. • Clicking a failure alert entry opens the alert detail view. • Clicking an inspection entry opens the inspection report.- Link is dynamically constructed based on event type and record ID. | Title: View Source Description: Click to navigate to the original item (e.g., service order, alert, or report) that this log entry refers to. |
8. Sample Data
Facility Registry Sample:
Facility: Water Treatment Plant A (FAC-001)
Type: Water Treatment Plant
Location: North District (40.7128, -74.0060)
Capacity: 50/45.2 MLD (90% current utilization)
Systems: 3 active (Treatment, Distribution, Monitoring)
Networks: 2 connected (Primary Distribution, Secondary Supply)
Assets: 12 total (condition scores ranging 68-91)
Condition Score: 82 (Good) - Last assessed June 15, 2025
Risk Score: 65 (Medium) - Last assessed May 30, 2025
Asset Hierarchy Sample:
Facility: Water Treatment Plant A
├── System: Primary Clarifier System (Score: 45 - Poor)
│   ├── Asset: Pump P-102 Motor (Score: 30 - Poor)
│   ├── Asset: Clarifier Scraper Arm (Score: 35 - Poor)
│   └── Asset: Valve V-501 Actuator (Score: 40 - Poor)
├── System: Chlorine Disinfection System (Score: 88 - High Risk)
│   ├── Asset: Chlorine Injector #2 (Score: 95 - High Risk)
│   └── Asset: Main Electrical Breaker MB-1 (Score: 91 - High Risk)
└── System: Filtration Unit E (Score: 76 - Fair)
    └── Asset: Filter Assembly B2 (Score: 72 - Fair)
Preventive Maintenance Schedule Sample:
Schedule: Monthly Pump Inspection - Station 3 (PM-PUMP-001)
Type: Preventive Maintenance
Frequency: Monthly (24 runs completed, 5 assets covered)
Next Due: 2025-07-15
Last Completed: 2025-06-15
Progress: 3/5 Completed
Status: Active
Associated Assets: Main Pump Unit (AST-001), Backup systems
Condition Impact: Maintains pump performance above 85% efficiency
Activity Log Sample:
2024-06-28 14:30 - Service Order Creation
Created service order SO-001 for pump maintenance
User: John Smith
Impact: Scheduled preventive maintenance for main pump unit

2024-06-27 16:45 - Inspection Completion
Completed routine inspection of filtration system
User: Sarah Johnson
Result: All parameters within acceptable ranges

2024-06-26 08:20 - Failure Report
Reported failure in control valve C3
User: System Alert
Action: Pressure drop detected, immediate attention required
9. Acceptance Criteria
- The system must provide a streamlined facility creation wizard that reduces data entry time by 60% through intelligent defaults and automation.
- The system must automatically discover and register assets within new facilities using IoT sensors, SCADA integration, and network scanning capabilities.
- The system must maintain accurate asset hierarchies with automatic validation of relationships between facilities, systems, networks, and individual assets.
- The system must aggregate individual asset condition scores into system and facility-level health metrics using configurable weighting algorithms.
- The system must integrate preventive maintenance scheduling with real-time asset condition data to optimize maintenance timing and resource allocation.
- The system must provide real-time synchronization of asset data across work order management, compliance monitoring, and operational dashboard systems.
- The system must support bulk asset import and export capabilities with automated data validation and error reporting.
- The system must provide comprehensive audit trails for all asset registry changes with user identification and change justification requirements.
- The system must offer mobile access for field-based asset management with offline capabilities and automatic synchronization.
- The system must integrate with GIS systems to provide accurate location-based asset management and geographic visualization capabilities.
- The system must generate automated alerts when asset conditions change significantly or maintenance schedules become overdue.
- The system must provide customizable asset dashboards with drill-down capabilities from facility to individual asset levels.
- The system must support QR code and RFID integration for rapid asset identification and data access in field operations.
- The system must maintain 99.9% uptime for asset registry operations with automatic backup and recovery capabilities.
- The system must process asset condition updates and propagate changes to connected systems within 5 minutes.
- The system must provide comprehensive asset relationship mapping with impact analysis for maintenance and operational planning.
- The system must support multi-level user permissions with role-based access control for different asset management responsibilities.
- The system must generate automated compliance reports that include asset condition data and maintenance history for regulatory submissions.
- The system must provide asset lifecycle cost analysis with replacement timing recommendations based on condition trends and financial data.
- The system must integrate with document management systems to associate technical documentation, warranties, and specifications with specific assets.
10. Process Changes
Current Process | New Process | Impact Analysis |
|---|---|---|
From: Manual facility creation requiring multiple disconnected data entry screens with extensive documentation requirements To: Intelligent facility creation wizard with automated asset discovery, smart defaults, and integrated documentation management | Reduces facility onboarding time by 70% and improves data quality through automated validation and intelligent prefilling | |
From: Separate condition assessments for facilities, systems, and assets without integrated analysis To: Unified condition assessment that automatically aggregates asset health to system and facility levels with integrated risk analysis | Improves decision-making accuracy by 45% through comprehensive condition visibility and reduces assessment time by 50% through automated aggregation | |
From: Manual preventive maintenance scheduling based on fixed intervals without condition consideration To: Condition-based maintenance scheduling that adapts to actual asset health, facility priorities, and resource constraints | Optimizes maintenance effectiveness by 40% and reduces unnecessary maintenance by 30% through condition-driven scheduling | |
From: Siloed asset data requiring manual synchronization with operational systems To: Real-time asset data integration with automatic propagation to work orders, compliance monitoring, and performance dashboards | Eliminates data synchronization errors and improves operational decision-making by 35% through real-time asset information access | |
From: Complex asset hierarchy management with manual relationship maintenance To: Automated asset relationship mapping with intelligent hierarchy validation and impact analysis capabilities | Reduces hierarchy maintenance time by 60% and improves asset relationship accuracy through automated validation and conflict detection | |
From: Paper-based or disconnected field asset management requiring office data entry To: Mobile asset management with offline capabilities, QR code integration, and automatic synchronization | Improves field productivity by 50% and reduces data entry errors by 80% through direct field data capture and validation |
11. Impact from Solving This Problem
Metric Category | Improvement | Description |
|---|---|---|
Asset Onboarding Efficiency | 70% reduction in facility creation time | Intelligent wizards and automated discovery streamline new facility and asset registration processes |
Data Quality and Accuracy | 85% improvement in asset data completeness | Automated validation and integration eliminate manual data entry errors and ensure consistent information |
Condition Assessment Effectiveness | 50% faster multi-level condition analysis | Integrated assessment workflows and automated aggregation accelerate facility health evaluation |
Maintenance Optimization | 40% improvement in maintenance effectiveness | Condition-based scheduling and integrated planning optimize resource allocation and asset performance |
Operational Decision Speed | 60% faster asset-related decision making | Real-time asset data integration and comprehensive dashboards accelerate informed decision-making |
Cross-System Integration | 90% reduction in data synchronization errors | Automated asset data propagation eliminates manual coordination and ensures consistent information |
Field Productivity | 50% improvement in field asset management | Mobile capabilities and automated workflows enhance field team efficiency and data accuracy |
Asset Relationship Management | 65% improvement in hierarchy maintenance accuracy | Automated relationship validation and impact analysis ensure accurate asset interdependency management |
12. User Behavior Tracking
Asset Manager (Facility & Asset Registry Focus) Tracking Plan:
Event Category | Specific Events | Properties Tracked | Key Questions Answered |
|---|---|---|---|
Facility Onboarding | Facility creation wizard usage, Asset discovery success rates, Hierarchy establishment completion | Creation time, Automation utilization, Data quality scores | How effectively is the streamlined onboarding process reducing registration time and improving data quality? |
Asset Hierarchy Management | Relationship creation/modification, Hierarchy validation, Impact analysis usage | Relationship complexity, Validation success, Analysis frequency | How well is automated relationship management maintaining accurate asset hierarchies? |
Condition Assessment Integration | Multi-level assessment execution, Score aggregation accuracy, Trend analysis usage | Assessment frequency, Aggregation performance, Decision impact | Are integrated condition assessments improving facility health visibility and decision-making? |
Maintenance Schedule Optimization | Condition-based adjustments, Schedule modifications, Resource coordination | Optimization frequency, Schedule adherence, Resource efficiency | How effectively is intelligent scheduling improving maintenance outcomes and resource utilization? |
Asset Data Integration | Cross-system synchronization, Real-time updates, Integration performance | Sync success rates, Update latency, System utilization | Is real-time asset data integration eliminating synchronization issues and improving operational visibility? |
Mobile Asset Management | Field data entry, Offline usage, QR code scanning | Mobile utilization, Offline performance, Field productivity | How well are mobile capabilities improving field asset management efficiency and data accuracy? |
Performance Analytics | Dashboard usage, Report generation, Benchmarking analysis | Analytics frequency, Report types, Decision correlation | Are comprehensive asset analytics providing valuable insights for strategic asset management decisions? |
Key Insights from Tracking:
- Onboarding Efficiency: Measuring facility creation time and automation utilization shows streamlining effectiveness
- Data Quality Impact: Tracking validation success and completeness rates demonstrates data improvement value
- Condition Assessment Value: Monitoring aggregation accuracy and decision impact indicates assessment integration success
- Maintenance Optimization: Measuring schedule adherence and resource efficiency shows intelligent scheduling benefits
- Integration Effectiveness: Tracking synchronization success and update performance validates real-time integration value
- Mobile Productivity: Monitoring field usage and offline performance demonstrates mobile capability impact on operations
Wireframe
Wireframe Link
Reference Link
No Comments