User Story: Service Order History (AX03US02)
1. Problem Statement
This user story focuses on the need for comprehensive analysis and reporting on completed maintenance work. The primary user is the O&M Manager, who requires historical data to track performance, analyze costs, understand failure patterns, and justify departmental budgets.
Primary User Role & Pain Points:
- O&M Manager:
- No Performance Baseline: Lacks aggregated data on past performance, making it impossible to know if the maintenance team is improving, getting more efficient, or becoming more costly over time.
- Inability to Analyze Costs: Cannot easily determine the average cost per service order or identify which types of jobs are the most expensive, preventing effective cost control and budgeting.
- Reactive vs. Proactive Blind Spot: Struggles to quantify the balance between planned (preventive) and unplanned (corrective) maintenance, a key indicator of a healthy maintenance program.
- Poor Failure Analysis: Has no centralized, searchable record of past failures, making it difficult to identify recurring problems with specific assets or locations.
- Time-Consuming Reporting: Spends hours or days manually compiling data from spreadsheets and paper records to generate basic performance reports for executive leadership or regulatory bodies.
Core Problem:
For the O&M Manager, the lack of an accessible and analytical service order history means that valuable data from completed work is lost. Without the ability to analyze historical trends in cost, labor, and failures, they cannot optimize their maintenance strategies, control their budget, or transition from a reactive to a proactive maintenance culture.
2. Who Is the User Facing the Problem?
The O&M Manager is the most important user for this feature. While others might view the data, the O&M Manager is directly responsible for the performance and budget of the maintenance department. This historical view provides the critical business intelligence they need to analyze past performance, plan future work, justify their budget, and report on their team's effectiveness to senior leadership.
Access Control:
The O&M Manager and Asset Manager should have full read and export access. The Utility Administrator would also have full access. Other roles like Dispatcher or Plant Supervisor may have read-only access for their specific areas of responsibility.
3. Jobs To Be Done
- For the O&M Manager: When I need to justify my annual maintenance budget and plan for the upcoming year, but I cannot easily analyze historical costs, labor, or the effectiveness of my maintenance program, help me by providing an analytical dashboard that aggregates all completed service order data, so that I can identify cost-saving opportunities, demonstrate the value of preventive maintenance, and make data-driven decisions to optimize my operations.
4. Solution
The proposed solution is a Service Order History module, an analytical dashboard designed for performance tracking and analysis of all completed work. It aggregates historical data into high-level KPIs and provides a detailed, searchable record of every completed service order.
Key Capability Areas:
- Historical Performance KPI Dashboard:
- A dashboard summarizing key historical metrics over the last 12 months.
- Includes
Total Completed SOs,Average Cost Per SO,PM vs CM Ratio, andTotal Labor Hours.
- Detailed Maintenance History Log:
- A comprehensive, searchable, and filterable table of all completed service orders.
- Provides detailed columns including SO Name, Asset ID/Name, Location, Type, Completion Date/Time, Technician, Total Cost, Labor Hours, and Failure Mode.
- Cost and Labor Analysis:
- The
Average Cost Per SOKPI provides a high-level financial baseline. - The
Total Costand labor hours are broken down for each individual service order, allowing for granular cost analysis.
- The
- Preventive vs. Corrective Maintenance Ratio:
- A dedicated
PM vs CM RatioKPI gives a clear, immediate insight into the health and proactivity of the maintenance program.
- A dedicated
- Failure Mode Tracking:
- A "Failure Mode" column in the history log captures the specific reason for corrective maintenance, enabling powerful failure analysis.
- Contextual Actions and Reporting:
- An "Actions" menu for each historical record allows the user to view details, print a report of the completed work, or link to related schedules.
- A global "Export Data" function to download the filtered historical data for offline analysis or reporting.
5. Major Steps Involved
User Role: O&M Manager
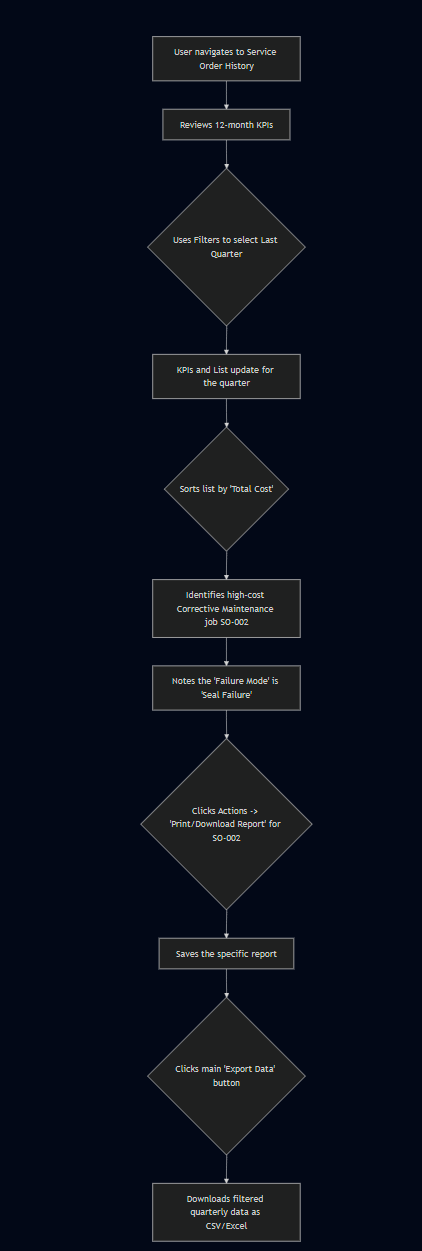
Flow 1: Analyzing Maintenance Performance for a Quarterly Report
6. Flow Diagram
7. Business Rules
This section provides a detailed breakdown of rules for every visible element on the screen.
A. Service Order History (Dashboard View)
- Page Title/Subtitle: Static descriptive text.
- Button: "Export Data"
- Must export the data currently displayed in the "Maintenance History" table, respecting all active filters.
- Export format should be CSV or XLSX.
- KPI Card: "Total Completed SOs"
- Formula:
COUNT(Service Orders)whereStatus= 'Completed' andCompletionDateis within the selected time frame (default: "Last 12 months").
- Formula:
- KPI Card: "Average Cost Per SO"
- Formula:
AVG(TotalCost)for all service orders counted in the "Total Completed SOs" KPI. Must be formatted as currency (e.g., $1,275.32).
- Formula:
- KPI Card: "PM vs CM Ratio"
- Formula: This is two calculations displayed together.
PM % = (COUNT(SOs) where Type = 'Preventive' / Total Completed SOs) * 100CM % = (COUNT(SOs) where Type = 'Corrective' / Total Completed SOs) * 100
- The display must be formatted as "XX% / YY%".
- Formula: This is two calculations displayed together.
- KPI Card: "Total Labor Hours"
- Formula:
SUM(LaborHours)for all completed SOs in the time frame. - The subtitle, "Avg X.XX hrs per SO," is calculated as
Total Labor Hours / Total Completed SOs.
- Formula:
- Search Bar: Must perform a live search on
SO ID,SO Name,Asset ID/Name, andDescriptionfields of the historical records. - Filters Button: Must open a modal or dropdown with filtering options, including but not limited to:
Date Range,Type(Preventive, Corrective, etc.),Failure Mode, andCompleted By(technician). - Table: "Maintenance History"
- This table must only display service orders with a
Statusof 'Completed'. - SO ID: The unique Service Order ID.
- SO Name: The title/summary of the service order.
- Asset ID / Name: The primary asset associated with the SO.
- Location: The location of the asset/work.
- Type: A colored tag indicating the order type (e.g., Preventive, Corrective, Inspection).
- Completed On: The exact date and time of completion.
- Completed By: The name of the technician who completed the work.
- Total Cost: The final cost of the SO, formatted as currency. The subtitle must show the labor hours (e.g., "4.5h labor").
- Failure Mode: If the
Typeis 'Corrective', this field displays the recorded failure mode. It should display "N/A" for non-corrective types. - Actions ("..."): A menu button that must reveal the following options:
View Details: Navigates to a read-only detailed view of the completed service order.Print/Download Report: Generates a formatted PDF or printable HTML page summarizing the service order.View Linked PM Schedule: If the SO was generated from a schedule, this link navigates to that schedule. This option should be disabled if there is no linked schedule.
- This table must only display service orders with a
8. Sample Data
Historical Service Order Record (for SO-002):
- SO ID: SO-002
- SO Name: Emergency Valve Repair
- Asset ID / Name: VLV-045, Main Control Valve
- Location: Distribution Station 2
- Type: Corrective
- Completed On: Jun 14, 2024 09:15
- Completed By: Mike Johnson
- Total Cost: $850.75
- Labor Hours: 6h
- Failure Mode: Seal Failure
- Linked PM Schedule: N/A
9. Acceptance Criteria
- The system must display the four KPI cards with correctly calculated values based on a default 12-month period.
- The system must allow the user to filter the entire dashboard view by a custom date range.
- The system must correctly calculate the
PM vs CM Ratiobased on the 'Type' of completed orders. - The system must display a searchable and filterable table containing only 'Completed' service orders.
- The system must display the
Failure Modefor Corrective work orders and "N/A" for others. - The system must display both the
Total Costand the associatedLabor Hoursfor each completed order. - The "Actions" menu must provide functional links to
View DetailsandPrint/Download Report. - The
View Linked PM Scheduleaction must be disabled if the SO was not generated from a schedule. - The "Export Data" button must download the currently filtered list of historical orders.
- The
Average Cost Per SOKPI must be formatted as currency. - The search bar must query across multiple fields (ID, name, asset, etc.).
- All KPI cards and the list must update instantly when a filter is applied.
- The pagination controls must correctly navigate through the historical records.
- The
Total Labor HoursKPI must correctly display both the sum of all hours and the calculated average per SO. - The data presented must be read-only, as it is a historical record.
10. Process Changes
From: (Current Process) | To: (New Process) | Impact Analysis |
|---|---|---|
Performance reporting is a manual, time-consuming quarterly or annual effort using spreadsheets. | Performance tracking is an ongoing, real-time activity. The O&M Manager can access key metrics instantly at any time. | Justification: This transforms reporting from a burdensome periodic task into a continuous strategic activity. It reduces time spent on manual report generation by over 95%, freeing the manager to focus on analysis and action. |
The balance between planned and unplanned work is a "gut feeling" and not a measured KPI. | The | Justification: This elevates a critical industry benchmark to a top-level metric, allowing the O&M Manager to set clear goals (e.g., achieve an 80/20 ratio) and track progress towards a more proactive maintenance culture. |
Identifying recurring failures requires someone to manually read through old work orders or remember past events. | The history table can be filtered or sorted by | Justification: This enables data-driven root cause analysis. The manager can quickly identify systemic problems (e.g., a specific model of valve consistently has seal failures) and take corrective action, such as changing suppliers or updating maintenance procedures. |
11. Impact from Solving This Problem
Metric | How it Improves |
|---|---|
:white_check_mark: Data-Driven Budgeting & Forecasting | Provides the historical cost and labor data needed to create accurate, defensible budgets for future maintenance activities. |
:white_check_mark: Optimized Maintenance Strategies | By analyzing the |
:white_check_mark: Improved Accountability & Performance | The dashboard provides clear, objective metrics that the O&M Manager can use to track their team's performance, set improvement goals, and report on their department's effectiveness to leadership. |
:white_check_mark: Enhanced Asset Lifecycle Management | The historical cost and failure data for each asset is a critical input for the Asset Manager, helping them to calculate the total cost of ownership and make more informed decisions about when to repair vs. replace an asset. |
12. User Behavior Tracking
Primary User Role: O&M Manager
Metric/Event Name | Event Trigger | Properties Tracked | Question Answered for the O&M Manager |
|---|---|---|---|
View History Dashboard | O&M Manager lands on the history page. |
| How often is the manager reviewing historical performance? What are the key baseline metrics they see first? |
Filter History | O&M Manager applies a filter to the dashboard. |
| What specific questions is the manager trying to answer? Are they analyzing specific time periods, failure types, or technicians? |
Export History Data | O&M Manager clicks the "Export Data" button. |
| Is the manager performing deep offline analysis? What data sets are they exporting for reporting? |
View Detailed Report | O&M Manager clicks "Print/Download Report" from the actions menu. |
| Which specific completed jobs require a formal report? Are they typically high-cost, corrective, or related to a specific asset? |
Analyze Failures | O&M Manager filters the list by a specific |
| Is the manager actively using the system to perform root cause analysis on recurring failures? |
No Comments