CRM Campaign Management System - CRM05P1US5
1. Problem Statement
Core Problem: Marketing teams struggle with fragmented campaign management processes, lack of real-time performance visibility, and inability to optimize campaigns effectively due to disconnected tools and manual workflows.
User Roles Identified:
- Marketing Manager: Oversees campaign strategy and performance
- Campaign Specialist: Creates and executes marketing campaigns
- Sales Manager: Leverages campaign data for lead conversion
Pain Points by User Role:
Marketing Manager:
- Cannot get real-time visibility into campaign ROI and performance metrics
- Struggles to compare performance across multiple campaigns simultaneously
- Lacks integrated view of campaign timeline, budget utilization, and results
- Difficult to identify high-performing segments for future targeting
- Manual reporting processes consume significant time
Campaign Specialist:
- Managing multiple campaigns across different channels is fragmented
- No centralized platform to track hot leads and engagement levels
- Email template management and content organization is inefficient
- Difficulty in segment performance analysis and optimization
- Manual tracking of campaign activities and timeline management
Sales Manager:
- Hot leads from campaigns are not immediately visible or actionable
- Cannot easily track lead quality and conversion rates by campaign
- Lacks integration between marketing campaigns and sales pipeline
- Difficult to prioritize follow-up actions based on engagement levels
- No clear visibility into which campaigns generate the best sales outcomes
2. Who Are the Users Facing the Problem?
Marketing Manager
- Senior marketing professional responsible for campaign strategy, budget allocation, and performance measurement
- Needs executive-level dashboards and ROI analysis capabilities
Campaign Specialist
- Mid-level marketing professional who creates, executes, and monitors day-to-day campaign activities
- Requires detailed operational tools for campaign management and content creation
Sales Manager
- Sales leadership responsible for converting marketing-qualified leads into customers
- Needs real-time lead scoring and campaign attribution data
All three roles should have access to this feature with role-based permissions and customized dashboards.
3. Jobs To Be Done
For Marketing Manager: When I need to measure and optimize our marketing investment across multiple campaigns, But I lack integrated visibility into real-time ROI, budget utilization, and performance comparisons, Help me access unified campaign dashboards with automated performance tracking and budget monitoring, So that I can make data-driven decisions to improve marketing effectiveness and demonstrate clear ROI to executives.
For Campaign Specialist: When I need to execute multi-channel marketing campaigns and manage lead engagement, But I struggle with fragmented tools for content management, audience segmentation, and performance tracking, Help me access an integrated campaign management platform with email templates, segment analytics, and real-time engagement monitoring, So that I can efficiently manage campaigns end-to-end and optimize performance based on audience behavior.
For Sales Manager: When I need to identify and prioritize high-quality leads from marketing campaigns, But I cannot easily access lead scoring, engagement history, and campaign attribution, Help me get real-time visibility into hot leads with engagement context and campaign source tracking, So that I can prioritize follow-up activities and improve lead conversion rates.
4. Solution
A comprehensive CRM campaign management system that provides unified campaign oversight, real-time performance analytics, and integrated lead management capabilities.
Key Capability Areas:
Campaign Dashboard & Analytics
- Real-time campaign performance metrics (ROI, Open Rate, Click Rate, Conversion Rate)
- Comparative analytics across multiple campaigns
- Revenue attribution and budget utilization tracking
Campaign Timeline Management
- Visual campaign timeline with progress tracking
- Budget utilization monitoring with spending alerts
- Automated milestone and completion tracking
Lead Management & Scoring
- Hot leads identification with engagement scoring
- Real-time lead activity tracking and notifications
- Lead source attribution and campaign tagging
Segment Performance Analysis
- Detailed segment-wise performance comparison
- Geographic and demographic performance breakdowns
- Revenue tracking by customer segment
Email Campaign Management
- Email template library with performance tracking
- Send status monitoring and delivery analytics
- A/B testing capabilities for email optimization
Contact & Audience Management
- Centralized contact database with engagement history
- Audience segmentation and targeting tools
- Contact lifecycle and interaction timeline
Performance Over Time Tracking
- Historical performance trends and analysis
- Daily/weekly performance breakdowns
- Predictive performance modeling
Activity & Audit Management
- Complete campaign activity log and history
- User action tracking and change management
- Compliance and audit trail documentation
Integration & Automation
- CRM integration for seamless data flow
- Automated workflow triggers based on engagement
- Real-time synchronization across marketing channels
Reporting & Export Capabilities
- Customizable report generation
- Data export functionality for external analysis
- Automated report scheduling and distribution
5. Major Steps Involved
Phase 1: Campaign Setup & Launch
- Campaign Creation and Configuration
- Navigate to Campaigns module and click "Create Campaign"
- Define campaign parameters: name ("Q4 Product Launch"), type (Email Marketing), priority (High)
- Set timeline: Start date (2024-01-15), End date (2024-02-15)
- Configure budget allocation ($5,000 total budget)
- Assign campaign owner (Sarah Johnson)
- Audience Segmentation and Targeting
- Access Segments tab to configure target audiences
- Define segments with contact counts: Enterprise (450 contacts, North America), SMB (320 contacts, Europe), Startup (180 contacts, Asia)
- Set total target reach (2,847 contacts available)
- Configure segment-specific parameters and regional targeting
- Content Creation and Email Setup
- Navigate to Content tab for email template management
- Create/select email templates from library (Welcome Series Template)
- Configure email settings and tracking parameters
- Set up automated email sequences and timing
- Review content for compliance and brand guidelines
Phase 2: Campaign Execution & Monitoring
4. Campaign Launch and Initial Tracking
- Activate campaign status from Draft to Active
- Monitor initial send metrics: emails queued and delivered
- Track Email Send Management: Total Sent (1), Delivered (1), Opened (1), Failed/Bounced (0)
- Review real-time delivery performance and troubleshoot issues
- Performance Monitoring and Analytics
- Access campaign dashboard for real-time metrics
- Monitor key performance indicators: ROI (285%), Open Rate (70%), Click Rate (14%)
- Track contacts sent (2,250) against target population
- Review budget utilization progress (68% used, $1,800 remaining)
- Analyze campaign timeline completion (1916% Complete status shown)
- Segment Performance Analysis
- Navigate to Segments performance comparison view
- Analyze segment-specific metrics across Enterprise, SMB, and Startup audiences
- Review conversion rates: Enterprise (8%), SMB (5%), Startup (4%)
- Compare revenue generation: Enterprise ($28,520), SMB ($17,379), Startup ($43,800)
- Identify top-performing segments for optimization
Phase 3: Lead Management & Conversion
7. Hot Leads Identification and Management
- Monitor Hot Leads notifications ("Hot Leads from Q4 Product Launch" - 2 Leads)
- Review high-scoring leads: Sarah Johnson (Score 95), Michael Chen (Score 92)
- Analyze engagement levels (Very High Engagement indicators)
- Access detailed lead profiles with contact information and activity history
- Prioritize leads based on score, recency, and engagement depth
- Lead Follow-up and Conversion Tracking
- Navigate to Leads tab for comprehensive lead management
- Review pipeline metrics: Total Leads (1), Qualified Leads (0), Hot Leads (1), Pipeline Value ($25,000)
- Track lead progression and update status classifications
- Coordinate with sales team for immediate follow-up actions
- Document lead interactions and conversion outcomes
Phase 4: Analysis & Optimization
9. Performance Over Time Analysis
- Access Performance Over Time section for trend analysis
- Review daily performance breakdown: Jan 15 (300 Sent, 210 Opened, 42 Clicked, 8 Converted)
- Identify performance patterns across campaign duration
- Analyze peak engagement periods and optimization opportunities
- Track conversion trends and seasonal impacts
- Campaign Activity and Audit Review
- Navigate to Activities tab for complete campaign timeline
- Review activity log: Campaign Created (09:00:00), Campaign Started (10:00:00)
- Monitor user actions and system events with full attribution
- Track campaign modifications and configuration changes
- Maintain compliance documentation and audit trails
- Reporting and Data Export
- Generate comprehensive campaign reports using Export Activities
- Create custom performance dashboards for stakeholders
- Schedule automated reporting for ongoing campaign monitoring
- Export data for external analysis and presentation
- Share insights across marketing and sales teams
- Campaign Optimization and Future Planning
- Analyze overall campaign effectiveness and ROI achievement
- Identify successful strategies for future campaign replication
- Document lessons learned and optimization recommendations
- Plan follow-up campaigns based on segment performance data
- Update audience segmentation and targeting strategies for improved results
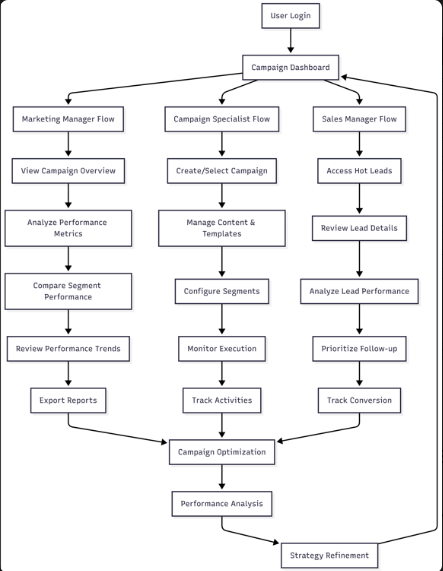
6. Flow Diagram
7. Business Rules
Campaigns Overview Screen
Summary Metrics Cards
- Active Campaigns Card:
- Displays count of currently running campaigns (2)
- Click to filter campaigns list to active status only
- Updates automatically when campaigns are activated/deactivated
- Total Reach Card:
- Shows aggregated contact reach across all campaigns (6,562)
- Calculated as sum of unique contacts across all active campaigns
- Updates in real-time as new contacts are added to campaigns
- Avg Open Rate Card:
- Displays average email open rate across all campaigns (69%)
- Calculated as weighted average based on email volume per campaign
- Updates daily based on email engagement data
- Total ROI Card: ( PHASE 2)
- Shows overall return on investment across campaigns (310%)
- Calculated as (Total Revenue - Total Campaign Costs) / Total Campaign Costs * 100
- Updates when revenue or cost data is modified
Campaign Search and Filters
- Search campaigns... Field:
- Text input for campaign name amd tags search
- Minimum 2 characters required to trigger search
- Clears with X button or empty field
Campaign List Items
- Campaign Name:
- Campaign Status:
- "Active" - Green badge, campaign is running
- "Paused" - Yellow badge, campaign temporarily stopped
- "Completed" - Gray badge, campaign finished
- "Draft" - Blue badge, campaign not yet launched
- Campaign Type:
- "Email Marketing" - Email-based campaign
- "Multi-channel" - Cross-platform campaign
- "SMS" - Text message campaign
- "Social Media" - Social platform campaign
- Priority Indicator:
- "High" - Red badge for urgent campaigns
- "Medium" - Yellow badge for standard campaigns
- "Low" - Green badge for low-priority campaigns
- Date Range: Shows campaign duration in MM-DD-YY to MM-DD-YY format
- Contact Count: Displays number of contacts in campaign (2,847 contacts)
- Assigned User(created by): Shows campaign owner/manager name
- Target Segments: Shows segment tags (Enterprise Prospects, Product Trial Users, Premium Customers)
Campaign Performance Metrics Row
- Sent Count: Number of emails/messages sent (2,250)
- Open Rate Percentage: Email open rate with color coding (70%)
- Click Rate Percentage: Click-through rate with color coding (14%)
- Conversion Rate Percentage: Conversion to desired action (2.8%)
- ROI Percentage: Return on investment with color coding (285%) (phase 2)
Budget Progress Bar (PHASE- 2)
- Budget Progress Visualization: Horizontal bar showing spend progress
- Budget Labels: Shows "Product Launch", "Enterprise", "Email" categories
- Budget Amount: Displays spent vs total budget ($3,200 / $5,000)
Hot Leads Indicator
- Hot Leads Badge: Red badge showing "Hot Leads (2)" with flame icon
- Hot Leads Count: Number in parentheses indicates lead quantity
- Action Buttons: View/expand buttons to access hot leads detail
Hot Leads Popup
Hot Leads Header
- Popup Title: "Hot Leads from 'Q4 Product Launch'"
- Lead Count Badge: "2 Leads" with red background
- Close Button (X): Closes the popup and returns to main view
Individual Lead Cards
- Lead Initials: Circular avatar with person's initials (SJ, MC)
- Lead Name: Full name as clickable link (Sarah Johnson, Michael Chen)
- Engagement Level Badge:
- "Very High Engagement" - Red badge for top engagement
- "High Engagement" - Orange badge for good engagement
- "Medium Engagement" - Yellow badge for moderate engagement
- Job Title & Company:
- Position title (VP of Sales, CTO)
- Company name (TechCorp Solutions, InnovateTech)
- Score number (Score: 95, Score: 92)
Lead Contact Information
- Email Address: Clickable email link for direct communication
- Phone Number: Clickable phone number for direct calling
- Source Information: Shows lead acquisition source ("Email Click", "Multiple Opens")
- Last Activity: Time since last engagement ("2 hours ago", "1 day ago")
Lead Action Buttons
Campaign Detail View
Campaign Header Section
- Back to Campaigns Arrow: Returns to campaigns list view
- Campaign Name: "Q4 Product Launch" with editable capability
- Campaign Status: "Active" badge with green indicator
- Campaign Description: "Launch campaign for our new enterprise software suite"
Action Buttons Row
Performance Metrics Cards
- ROI Card: (PHASE 2)
- Large percentage display (285%)
- Trend indicator arrow (green up arrow +12.5%)
- Revenue amount ($15,750 revenue)
- Label "ROI"
- Open Rate Card:
- Percentage display (70%)
- Trend indicator (+6.3%)
- Opens count (1,575 opens)
- Label "Open Rate"
- Click Rate Card:
- Percentage display (14%)
- Trend indicator (+5.2%)
- Clicks count (315 clicks)
- Label "Click Rate"
- Contacts Sent Card:
- Contact count (2,250)
- Progress indicator (74%)
- Target comparison (of 2,847 target)
- Label "Contacts Sent"
Campaign Timeline Section
- Timeline Header: "Campaign Timeline" with calendar icon
- Start Date: "Started: 2024-01-15"
- End Date: "Ends: 2024-02-15"
- Progress Bar: Visual timeline with completion percentage (1916% Complete)
- Timeline Labels: "Start", "Today", "End" markers
Budget Utilization Section(PHASE2)
- Budget Header: "Budget Utilization" with dollar icon
- Spent Amount: "Spent: $3,200"
- Budget Total: "Budget: $5,000"
- Remaining: "$1800 remaining"
- Utilization Percentage: "68% used"
- Profit Indicator: "$12,550 profit"
- Progress Bar: Visual budget consumption indicator
Summary
- Conversions Card:
- Count display (63)
- Rate percentage (2.8% rate)
- Label "Conversions"
- Bounced Card:
- Count display (45)
- Rate percentage (2% rate)
- Label "Bounced"
- Unsubscribed Card:
- Count display (12)
- Rate percentage (0.5% rate)
- Label "Unsubscribed"
Campaign Type Indicator
- Email Marketing Badge: Blue badge showing campaign type
- Campaign Type Label: "Active" status with type specification
Campaign Detail Tabs
Tab Navigation Bar
- Performance Tab: Selected state shows performance metrics
- Contacts Tab: Shows campaign contact management
- Segments Tab: Shows audience segment analysis
- Content Tab: Shows email templates and content
- Leads Tab: Shows lead generation and management
- Config Tab: Shows campaign configuration settings (mentioned as existing)
- Email Sends Tab: Shows email delivery management
- Activities Tab: Shows campaign activity log
- History Tab: Shows campaign change history
Performance Tab Content
Email Funnel Section
Your Email Funnel Header
- Section Title: "Your Email Funnel" displays campaign email flow analysis
- Funnel Description Text: "Expert Insights analyzes each layer of your email funnel to determine leakage points (such as blocked emails) and opportunities to improve deliverability and engagement."
- Insight Indicators:
- Red bullet point: "Identify deliverability issues before they impact your business"
- Blue bullet point: "Learn how to increase engagement among your recipients"
Funnel Visual Bars
- Sent Bar:
- Dark gray/charcoal bar representing total emails sent
- Text label "Sent" in white text on bar
- No percentage or count displayed on bar itself
- Delivered Bar:
- Blue bar representing successfully delivered emails
- Text label "Delivered" in white text on bar
- Narrower than Sent bar to show delivery rate visually
- Unique Opened Bar:
- Purple bar representing emails opened by recipients
- Text label "Unique Opened" in white text on bar
- Narrower than Delivered bar to show open rate progression
- Unique Clicked Bar:
- Purple bar representing emails clicked by recipients
- Text label "Unique Clicked" in white text on bar
- Narrowest bar to show click rate drop-off
Funnel Metrics Panel
- Total Sent Field:
- Label: "Total Sent: 490"
- Shows total number of emails sent in campaign
- Non-editable display field
- Total Delivered Field:
- Label: "Total Delivered: +90.2% 442"
- Shows delivered count with trend indicator (+90.2%)
- Sub-metrics: "Bounced: 34 6.94%, Blocked: 8 1.63%"
- Non-editable display field
- Total Unique Opened Field:
- Label: "Total Unique Opened: 51.13% 226"
- Shows unique opens with percentage and count
- Sub-metric: "Spam Reports: 1 0.22%"
- Non-editable display field
- Total Unique Clicked Field:
- Label: "Total Unique Clicked: 14.03% 62"
- Shows unique clicks with percentage and count
- Sub-metric: "Unsubscribes: 0 0%"
- Non-editable display field
Performance Metrics Cards Row
Delivery Rate Card
- Metric Value: "90.2%" large display
- Trend Indicator: "+1.6%" showing positive change
- Card Icon: Envelope/mail icon indicator
- Label: "Delivery Rate"
- Calculation: (Total Delivered / Total Sent) * 100
Open Rate Card
- Metric Value: "51.13%" large display
- Trend Indicator: "+2.1%" showing positive change
- Card Icon: Eye/visibility icon indicator
- Label: "Open Rate"
- Calculation: (Unique Opens / Total Delivered) * 100
Click Rate Card
- Metric Value: "14.03%" large display
- Trend Indicator: "+1.1%" showing positive change
- Card Icon: Cursor/pointer icon indicator
- Label: "Click Rate"
- Calculation: (Unique Clicks / Total Delivered) * 100
Bounce Rate Card
- Metric Value: "6.94%" large display
- Trend Indicator: "+1.8%" showing change (may be negative trend)
- Card Icon: Warning/bounce icon indicator
- Label: "Bounce Rate"
- Calculation: (Total Bounces / Total Sent) * 100
Performance by Segment Section
Section Header
- Section Title: "Performance by Segment" with analytics icon
- Expand/Collapse Button: Toggle to show/hide segment details
Segment Performance Rows
- Enterprise Segment Row:
- Segment Name: "Enterprise" label
- Open Rate: "70%" with blue text styling
- Click Rate: "14%" percentage display
- Conv. Rate: "2.8%" conversion rate display
- Revenue Amount: "$12,000" in green text (top right)
- SMB Segment Row:
- Segment Name: "SMB" label
- Open Rate: "70%" with blue text styling
- Click Rate: "14%" percentage display
- Conv. Rate: "2.8%" conversion rate display
- Revenue Amount: "$8,100" in green text (top right)
- Startup Segment Row:
- Segment Name: "Startup" label
- Open Rate: "70%" with blue text styling
- Click Rate: "14%" percentage display
- Conv. Rate: "2.7%" conversion rate display
- Revenue Amount: "$3,600" in green text (top right)
Segment Metrics Rules
- Open Rate Calculation: (Segment Opens / Segment Delivered) * 100
- Click Rate Calculation: (Segment Clicks / Segment Delivered) * 100
- Conversion Rate Calculation: (Segment Conversions / Segment Sent) * 100
- Revenue Tracking: Total revenue attributed to each segment
Device Performance Section
Section Header
- Section Title: "Device Performance" with device icon
- Chart Type: Donut/pie chart visualization
Device Performance Chart
- Chart Display: Circular donut chart with three segments
- Desktop Segment: Blue section (largest portion)
- Mobile Segment: Green section (medium portion)
- Tablet Segment: Orange/yellow section (smallest portion)
- Center Hole: White center space in donut chart
Device Legend
- Desktop Legend Item:
- Blue dot indicator
- "Desktop" text label
- Clickable to toggle segment visibility
- Mobile Legend Item:
- Green dot indicator
- "Mobile" text label
- Clickable to toggle segment visibility
- Tablet Legend Item:
- Orange dot indicator
- "Tablet" text label
- Clickable to toggle segment visibility
Device Performance Rules
- Chart Interactivity: Click legend items to show/hide chart segments
- Percentage Calculation: Each device type shows percentage of total opens
- Data Source: Based on email open tracking by device type
- Chart Animation: Smooth transitions when toggling segments
- Hover Effects: Show detailed metrics on chart segment hover
Performance by Time of Day Section
Section Header
- Section Title: "Performance by Time of Day" with clock icon
- Chart Type: Horizontal bar chart with time intervals
Time-Based Bar Chart
- Y-Axis Scale: Numbered scale from 0 to 220
- X-Axis Time Intervals: 6 AM, 9 AM, 12 PM, 3 PM, 6 PM
- Chart Bars: Horizontal bars showing performance at each time slot
Time Slot Performance Bars
- 6 AM Time Slot:
- Blue bar (shortest) - approximately 40 units height
- Green bar (very short) - approximately 5 units height
- Orange bar (minimal) - approximately 2 units height
- 9 AM Time Slot:
- Blue bar (medium) - approximately 120 units height
- Green bar (short) - approximately 20 units height
- Orange bar (minimal) - approximately 5 units height
- 12 PM Time Slot:
- Blue bar (tall) - approximately 180 units height
- Green bar (medium) - approximately 35 units height
- Orange bar (short) - approximately 8 units height
- 3 PM Time Slot:
- Blue bar (tallest) - approximately 220 units height
- Green bar (medium) - approximately 40 units height
- Orange bar (short) - approximately 10 units height
- 6 PM Time Slot:
- Blue bar (tall) - approximately 160 units height
- Green bar (medium) - approximately 30 units height
- Orange bar (short) - approximately 8 units height
Time Chart Rules
- Data Representation: Each bar represents email engagement at specific times
- Color Coding: Three different metrics per time slot (opens, clicks, conversions)
- Peak Performance: 3 PM shows highest engagement across all metrics
- Trend Analysis: Performance builds from morning to peak afternoon
- Time Zone: All times displayed in campaign owner's time zone
- Hover Functionality: Show exact numbers when hovering over bars
Contact Tab
- Contact
- Company & Position
- Score
- Campaign Status
- Score
- Last Activity
- Actions
- bulk select option
- filters - campaign status , segments
- add contacts tab - allows you to add contacts to this campaign.
Segment Performance Comparison
Summary Metrics Cards
Total Contacts Card
- Icon: People/users icon indicator
- Metric Value: "950" - total number of contacts across all segments
- Label: "Total Contacts"
- Calculation: Sum of all contacts in active segments
- Click Action: Expands to show contact breakdown by segment
- Update Frequency: Real-time when contacts are added/removed
Active Segments Card
- Icon: Target/bullseye icon indicator
- Metric Value: "3" - number of currently active segments
- Label: "Active Segments"
- Calculation: Count of segments with "Active" status
- Click Action: Filters segment table to show only active segments
- Update Frequency: Immediate when segment status changes
Avg Open Rate Card
- Icon: Envelope/mail icon indicator
- Metric Value: "46%" - average open rate across all segments
- Label: "Avg Open Rate"
- Calculation: Weighted average of segment open rates by contact volume
- Click Action: Shows detailed open rate breakdown by segment
- Update Frequency: Hourly based on email engagement data
Total Revenue Card
- Icon: Dollar/currency icon indicator
- Metric Value: "$102,258" - total revenue generated across all segments
- Label: "Total Revenue"
- Calculation: Sum of revenue attributed to all segments
- Click Action: Opens revenue analytics with segment attribution
- Update Frequency: Daily based on conversion tracking
Segment Performance Comparison Chart
Chart Header
- Chart Title: "Segment Performance Comparison"
- Chart Type: Vertical bar chart with grouped bars per segment
Chart Structure
- Y-Axis Scale: Numbered scale from 0 to 60
- X-Axis Labels: "Enterprise", "SMB", "Startup" segment names
- Grid Lines: Horizontal reference lines at intervals of 15 (0, 15, 30, 45, 60)
Enterprise Segment Bars
- Blue Bar: Primary metric bar - height approximately 30 units
- Purple Bar: Secondary metric bar - height approximately 15 units
- Green Bar: Tertiary metric bar - height approximately 5 units
- Bar Spacing: Grouped closely together under "Enterprise" label
SMB Segment Bars
- Blue Bar: Primary metric bar - height approximately 55 units (tallest)
- Purple Bar: Secondary metric bar - height approximately 10 units
- Green Bar: Tertiary metric bar - height approximately 5 units
- Bar Spacing: Grouped closely together under "SMB" label
Startup Segment Bars
- Blue Bar: Primary metric bar - height approximately 55 units (tallest)
- Purple Bar: Secondary metric bar - height approximately 8 units
- Green Bar: Tertiary metric bar - height approximately 6 units
- Bar Spacing: Grouped closely together under "Startup" label
Chart Interactivity
- Hover Effects: Show exact values when hovering over bars
- Click Actions: Click bar to drill down into segment details
- Legend: Three metric indicators (not visible but implied by three bar types)
- Zoom Functionality: Double-click chart area to zoom in/out
Campaign Segments Section
Section Header
- Section Title: "Campaign Segments" with target icon
- Add Segment Button: Blue button with plus icon and "Add Segment" text
- Button Action: Opens new segment creation modal/form
- Button State: Always enabled when user has segment creation permissions
Segments Table Headers
- Segment Name Column:
- Header text "Segment Name"
- Sortable column (click to sort alphabetically)
- Left-aligned text content
- Contacts Column:
- Header text "Contacts"
- Sortable column (click to sort by contact count)
- Right-aligned numeric content
- Region Column:
- Header text "Region"
- Sortable column (click to sort alphabetically by region)
- Left-aligned text content
- Open Rate Column:
- Header text "Open Rate"
- Sortable column (click to sort by percentage)
- Contains percentage value and progress bar
- Click Rate Column:
- Header text "Click Rate"
- Sortable column (click to sort by percentage)
- Contains percentage value and bullet indicator
- Conversion Rate Column:
- Header text "Conversion Rate"
- Sortable column (click to sort by percentage)
- Contains percentage value and trend arrow
- Revenue Column:
- Header text "Revenue"
- Sortable column (click to sort by dollar amount)
- Right-aligned currency values
- Distribution Column:
- Header text "Distribution"
- Sortable column (click to sort by percentage)
- Shows percentage of total campaign
- Actions Column:
- Header text "Actions"
- Non-sortable column
- Contains action buttons for each row
Enterprise Segment Row
- Segment Name: "Enterprise" - clickable text to open segment details
- Contacts: "450" - total contacts in segment
- Region: "North America" - geographic targeting region
- Open Rate: "32%" with progress bar indicator
- Click Rate: "16%" with bullet point indicator
- Conversion Rate: "5%" with upward trend arrow
- Revenue: "$27,182" - total revenue attributed to segment
- Distribution: "47%" - percentage of total campaign contacts
- Actions: Red delete/trash button for segment removal
SMB Segment Row
- Segment Name: "SMB" - clickable text to open segment details
- Contacts: "320" - total contacts in segment
- Region: "Europe" - geographic targeting region
- Open Rate: "51%" with progress bar indicator
- Click Rate: "11%" with bullet point indicator
- Conversion Rate: "5%" with upward trend arrow
- Revenue: "$55,763" - total revenue attributed to segment
- Distribution: "34%" - percentage of total campaign contacts
- Actions: Red delete/trash button for segment removal
Startup Segment Row
- Segment Name: "Startup" - clickable text to open segment details
- Contacts: "180" - total contacts in segment
- Region: "Asia" - geographic targeting region
- Open Rate: "55%" with progress bar indicator
- Click Rate: "9%" with bullet point indicator
- Conversion Rate: "7%" with upward trend arrow
- Revenue: "$19,313" - total revenue attributed to segment
- Distribution: "19%" - percentage of total campaign contacts
- Actions: Red delete/trash button for segment removal
Data Validation and Business Logic
Segment Creation Rules
- Minimum Contacts: Segments must contain at least 1 contact
- Maximum Segments: Campaign can have maximum 10 active segments
- Unique Names: Segment names must be unique within campaign
- Region Validation: Region must be selected from predefined list
- Contact Overlap: Contacts can belong to multiple segments
Contact Count Validation
- Total Consistency: Sum of segment contacts may exceed total contacts due to overlap
- Live Updates: Contact counts update when contacts are added/removed
- Bulk Operations: Support bulk contact assignment to segments
- Import Validation: Imported contacts validated against existing database
Performance Metrics Calculations
- Open Rate: (Segment Opens / Segment Delivered) * 100
- Click Rate: (Segment Clicks / Segment Delivered) * 100
- Conversion Rate: (Segment Conversions / Segment Sent) * 100
- Revenue Attribution: Sum of purchase values attributed to segment
- Distribution: (Segment Contacts / Total Campaign Contacts) * 100
Progress Bar Rules
- Open Rate Progress:
- 0-25%: Low performance indicator
- 26-50%: Medium performance indicator
- 51-75%: Good performance indicator
- 76-100%: Excellent performance indicator
- Click Rate Indicators:
- Bullet point size correlates to click rate percentage
- Larger bullets indicate higher click rates
- Minimum 1% required to show bullet indicator
- Trend Arrows:
- Upward arrow: Improvement over previous period
- Downward arrow: Decline from previous period
- Flat arrow: No significant change
- Calculation based on 7-day comparison
Interactive Element Behaviors
Table Row Actions
- Row Hover: Highlight entire row when mouse hovers
- Row Click: Click anywhere on row to open segment detail view
- Checkbox Selection: Support multi-row selection for bulk actions
- Context Menu: Right-click row for additional options
Delete Button Functionality
- Delete Confirmation: Show confirmation dialog before segment deletion
- Cascade Rules: Ask user how to handle contacts in deleted segment
- Undo Option: Provide 30-second undo after deletion
- Audit Trail: Log all segment deletions with timestamp and user
Content Tab
Content Metrics Row
- Total Sent Card:
- Count display (829)
- Send icon indicator
- Rate information (61% rate)
- Label "Total Sent"
- Total Opens Card:
- Count display (502)
- Eye icon indicator
- Rate information (61% rate)
- Label "Total Opens"
- Total Clicks Card:
- Count display (39)
- Click icon indicator
- Rate information (5% rate)
- Label "Total Clicks"
- Conversions Card:
- Count display (12)
- Conversion icon indicator
- Rate information (1% rate)
- Label "Conversions"
Content Sub-tabs
- Email Templates Tab: Selected tab for email template management
- Performance Analysis Tab: Tab for content performance metrics
- Content Trends Tab: Tab for content trend analysis
Email Templates Section
- Section Title: "Email Templates (1)" showing count of templates
- Create Template Button: Blue button to create new email template
Email Template Table
- Table Headers:
- Template: Template name and description
- Category: Template categorization
- Status: Active/inactive status
- Performance: Send and open metrics
- Open Rate: Percentage with progress bar
- Click Rate: Percentage with progress indicator
- Conversion Rate: Percentage with trend indicator
- Actions: Edit/delete/view buttons
Template Data Row
- Welcome Series Template:
- Name: "Welcome Series Template"
- Description: "Welcome to our platform!"
- Category: "Onboarding" with green active badge
- Performance: "829 sent, 502 opened"
- Open Rate: 53% with progress bar
- Click Rate: 18% with bullet indicator
- Conversion Rate: 7% with up trend arrow
- Action Icons: View, edit, and copy buttons
Leads Tab
Lead Metrics Row
- Total Leads Card:
- Count display (1)
- People icon indicator
- Label "Total Leads"
- Qualified Leads Card:
- Count display (0)
- Target icon indicator
- Label "Qualified Leads"
- Hot Leads Card:
- Count display (1)
- Fire icon indicator
- Trend arrow indicator
- Label "Hot Leads"
- Pipeline Value Card: (PHASE2)
- Dollar amount ($25,000)
- Dollar icon indicator
- Label "Pipeline Value"
Campaign Leads Section
- Section Title: "Campaign Leads (1)" with lead count
- Export Button: Download leads data
- Add Contacts Button: Blue button to add new contacts to campaign
Lead Filters
- All Statuses Dropdown: Filter leads by status (All Statuses selected)
- All Segments Dropdown: Filter leads by segment (All Segments selected)
Leads Table Headers
- Checkbox Column: Select individual or all leads
- Contact: Lead name and contact information
- Company & Position: Company name and job title
- Score: Lead scoring number
- Campaign Status: Status within campaign
- Engagement Level: Level of lead engagement
- Last Activity: Time since last interaction
- Actions: Contact and interaction buttons
Lead Data Row
- Sarah Johnson Row:
- Checkbox: Unchecked selection box
- Contact: "SJ" avatar, "Sarah Johnson", "sarah.johnson@techcorp.com"
- Company: "TechCorp Solutions", "VP of Sales"
- Score: "95" with high score indicator
- Status: "opened" with green badge
- Engagement: "High" level indicator
- Last Activity: "2 hours ago"
- Actions: Profile, email, and call buttons
Configuration Tab --- (covered in create campaign part)
Email Sends Tab
Email Send Metrics
- Total Sends Card:
- Count display (1)
- Send icon indicator
- Label "Total Sends"
- Delivered Card:
- Count display (1)
- Delivery icon indicator
- Success rate (100%)
- Label "Delivered"
- Opened Card:
- Count display (1)
- Open icon indicator
- Open rate (100% rate)
- Label "Opened"
- Failed/Bounced Card:
- Count display (0)
- Warning icon indicator
- Attention text "Needs attention"
- Label "Failed/Bounced"
Email Send Management Section
- Section Title: "Email Send Management"
- Pause Sending Button: Button to pause email campaign
- Search Field: "Search by email subject..." with magnifying glass icon
- All Statuses Filter: Dropdown to filter by send status
Email Send Table Headers
- Contact: Recipient contact information
- Subject: Email subject line
- Send Date: Date and time of email send
- Status: Delivery status of email
- Engagement: Recipient engagement metrics
- Attempts: Number of send attempts
- Actions: Action buttons for email management
Email Send Data Row
- Contact #1 Row:
- Contact: "01" avatar, "Contact #1", "template compliant"
- Subject: "Transform Your Business with TechCorp Solutions"
- Send Date: "2024-01-21 10:30 AM"
- Status: "delivered" with green check icon
- Engagement: "Opened on 21/01/2024, Clicked on 21/01/2024"
- Attempts: "1 / 3" showing current/max attempts
- Actions: View details button
Activities Tab
Activity Metrics Row
- Campaign Actions Card:
- Count display (2)
- Activity icon indicator
- Label "Campaign Actions"
- Email Activities Card:
- Count display (0)
- Email icon indicator
- Label "Email Activities"
- Configuration Changes Card:
- Count display (0)
- Settings icon indicator
- Label "Configuration Changes"
- Audience Changes Card:
- Count display (0)
- People icon indicator
- Label "Audience Changes"
Campaign Activities Section
- Section Title: "Campaign Activities (2)" with activity count
- Export Activities Button: Download activity data
- Search Field: "Search activities..." with magnifying glass
- Filter Dropdowns:
- All Types: Filter by activity type
- All Users: Filter by user who performed action
Activity Timeline
- Date Header: "Monday, January 15, 2024" with "2 activities" count
Activity Entries
- Campaign Started Activity:
- Time: "10:00:00"
- Icon: Play button icon
- Action: "Campaign Started"
- Description: "Campaign was started and first emails sent"
- User: "by John Doe" attribution
- Campaign Created Activity:
- Time: "09:00:00"
- Icon: Plus/creation icon
- Action: "Campaign Created"
- Description: "Campaign 'Q4 Product Launch' was created"
- User: "by John Doe" attribution
History Tab - Performance Over Time Section
Performance Chart
- Chart Title: "Performance Over Time"
- Date Range: Shows daily performance from Jan 15-21
- Checkboxes for Metrics:
- Jan 15: Checkbox with date selection
- Jan 16: Checkbox with date selection
- Jan 17: Checkbox with date selection
- Jan 18: Checkbox with date selection
- Jan 19: Checkbox with date selection
- Jan 20: Checkbox with date selection
- Jan 21: Checkbox with date selection
Daily Performance Columns
For each date row, four metric columns:
- Sent: Number of emails sent that day (300, 280, 320, 290, 310, 340, 410)
- Opened: Number of emails opened (210, 196, 224, 203, 217, 238, 287)
- Clicked: Number of email clicks (42, 39, 45, 41, 45, 48, 58)
- Converted: Number of conversions (8, 7, 9, 8, 9, 10, 12)
Detail View Navigation
Campaign Detail Funnel
- Your Email Funnel Section: Visual funnel representation
- Email Sent Bar: Shows percentage (285%) and recipients
- Delivered Bar: Shows percentage (70%) and delivery rate
- Unique Opened Bar: Shows percentage (14%) and opens
- Unique Clicked Bar: Shows percentage (12%) and clicks
Funnel Metrics Details
- Email Metrics: Performance breakdown with step-by-step analysis
- Sent: Total number (63) and rate (Campaign Timeline)
- Open Rate: Percentage (45) and rate (2% rate)
- Click Rate: Number (12) and rate (0.5% rate)
- Campaign Type: "Email Marketing" badge with "Active" status
General System Behaviors
Button States
- Enabled State: Full opacity, clickable, shows hover effects
- Disabled State: Reduced opacity, not clickable, gray appearance
- Loading State: Shows spinner or loading indicator during processing
- Selected State: Highlighted background or border for active items
Data Validation Rules
- Required Fields: Must be completed before form submission
- Email Format: Must contain valid email address format
- Phone Format: Must contain valid phone number format
- Date Range: End date must be after start date
- Budget Values: Must be positive numbers greater than zero
- Percentage Values: Must be between 0% and 100%
Real-time Updates
- Metrics Refresh: Updates every 15 minutes automatically
- Lead Scores: Updates when new engagement activity occurs
- Campaign Status: Changes immediately when user actions occur
- Budget Tracking: Updates when expenses are recorded
- Performance Charts: Refreshes with new data points daily
Export Functionality
- Supported Formats: CSV, PDF, Excel formats available
- Data Selection: Users can select specific data ranges and fields
- File Naming: Auto-generates descriptive filenames with timestamps
- Download Location: Files download to user's default download folder
- File Size Limits: Maximum 10MB per export file
Search Capabilities
- Partial Matching: Supports searching with incomplete terms
- Case Insensitive: Search works regardless of capitalization
- Multi-field Search: Searches across name, email, company fields
- Auto-complete: Suggests matching results as user types
- Search History: Remembers recent search terms for quick access
Note: AI Optimize and Auto-Optimize features will be implemented in Phase 2 of the system rollout.
8. Sample Data
Campaign Data:
{
"campaign": {
"name": "Q4 Product Launch",
"status": "Active",
"type": "Email Marketing",
"priority": "High",
"created_date": "2024-01-15",
"start_date": "2024-01-15",
"end_date": "2024-02-15",
"assigned_to": "Sarah Johnson",
"description": "Launch campaign for our new enterprise software suite"
}
}
Performance Metrics:
json
{
"metrics": {
"roi": "285%",
"roi_revenue": "$15,750",
"open_rate": "70%",
"total_opens": "1,575",
"click_rate": "14%",
"total_clicks": "315",
"contacts_sent": "2,250",
"total_reach": "6,562",
"conversion_rate": "2.8%",
"conversions": "63"
}
}
Segment Performance:
json
{
"segments": [
{
"name": "Enterprise",
"contacts": 450,
"region": "North America",
"open_rate": "45%",
"click_rate": "12%",
"conversion_rate": "8%",
"revenue": "$28,520",
"distribution": "47%"
},
{
"name": "SMB",
"contacts": 320,
"region": "Europe",
"open_rate": "20%",
"click_rate": "9%",
"conversion_rate": "5%",
"revenue": "$17,379",
"distribution": "34%"
},
{
"name": "Startup",
"contacts": 180,
"region": "Asia",
"open_rate": "57%",
"click_rate": "14%",
"conversion_rate": "4%",
"revenue": "$43,800",
"distribution": "19%"
}
]
}
Hot Leads Data:
json
{
"hot_leads": [
{
"name": "Sarah Johnson",
"company": "TechCorp Solutions",
"position": "VP of Sales",
"email": "sarah.johnson@techcorp.com",
"phone": "+1 (555) 123-4567",
"score": 95,
"engagement_level": "Very High Engagement",
"source": "Email Click",
"last_activity": "2 hours ago",
"notes": "Showed high interest in enterprise features, requested demo"
},
{
"name": "Michael Chen",
"company": "InnovateTech",
"position": "CTO",
"email": "m.chen@innovatetech.io",
"phone": "+1 (555) 987-6543",
"score": 92,
"engagement_level": "Very High Engagement",
"source": "Multiple Opens",
"last_activity": "1 day ago",
"notes": "Engaged with pricing content, visited product pages 5+ times"
}
]
}
9. Acceptance Criteria
- The system must display real-time campaign performance metrics including ROI, Open Rate, Click Rate, and Conversion Rate with automatic updates every 15 minutes
- The system must provide a campaign dashboard showing Active Campaigns count, Total Reach, Average Open Rate, and Total ROI across all campaigns
- The system must allow users to drill down into individual campaign details showing timeline progress, budget utilization, and detailed performance metrics
- The system must track and display Hot Leads with engagement scores above 90 and provide real-time notifications when new hot leads are identified
- The system must support segment-based performance analysis with visual charts comparing Enterprise, SMB, and Startup segment metrics
- The system must provide email template management with individual template performance tracking (Open Rate, Click Rate, Conversion Rate)
- The system must maintain a complete activity log showing all campaign actions, timestamps, and user attribution
- The system must calculate and display budget utilization as percentage with remaining budget amount ($3,200 spent / $5,000 budget)
- The system must support campaign timeline visualization showing start date, end date, current progress, and completion percentage
- The system must provide Performance Over Time tracking with daily breakdown of Sent, Opened, Clicked, and Converted metrics
- The system must enable export functionality for campaign activities, reports, and performance data in multiple formats (CSV, PDF, Excel)
- The system must support contact management with detailed interaction history and engagement timeline for each contact
- The system must automatically calculate lead pipeline value and track qualified vs hot leads distribution
- The system must provide role-based access control with different dashboard views for Marketing Managers, Campaign Specialists, and Sales Managers
- The system must integrate with CRM systems to sync hot leads and maintain consistent contact information
- The system must support multi-channel campaign tracking with email send status monitoring (Sent, Delivered, Opened, Failed/Bounced)
- The system must provide campaign comparison capabilities allowing users to analyze performance across multiple campaigns simultaneously
- The system must maintain data integrity with automatic validation of contact counts, segment assignments, and performance calculations
- The system must support real-time collaboration with shared access to campaign data and synchronized updates across user sessions
- The system must provide mobile-responsive design allowing access to key metrics and lead information from mobile devices
10. Process Changes
Process Area | From (Current State) | To (Future State) | Impact Analysis |
|---|---|---|---|
Campaign Performance Tracking | Manual spreadsheet compilation taking 4–6 hours weekly | Real-time dashboard with automated metrics updated every 15 minutes | 85% reduction in reporting time, enabling daily performance reviews instead of weekly |
Lead Management | Hot leads identified through manual email review and scoring | Automated lead scoring with real-time notifications for scores >90 | 70% faster lead identification, improving response time from 24–48 hrs to 2–4 hrs |
Segment Analysis | Monthly manual analysis across separate tools | Real-time segment performance comparison with visual analytics | 90% reduction in analysis time, enabling weekly optimization instead of monthly reviews |
Budget Monitoring | Weekly budget reconciliation from multiple sources | Real-time budget utilization tracking with automated alerts at 80% spend | 75% improvement in budget control accuracy, preventing overspend incidents |
Campaign Content Management | Email templates stored in separate tools with manual performance tracking | Centralized template library with integrated performance analytics | 60% improvement in template reusability and 45% better performance optimization |
Activity Tracking | Manual documentation in separate project management tools | Automated activity logging with complete audit trails | 80% improvement in compliance documentation and 100% activity capture rate |
11. Impact from Solving This Problem
Metric Category | Improvement Description |
|---|---|
Marketing Efficiency | 40% reduction in campaign setup and management time through integrated workflows and automated tracking |
Lead Response Time | 65% improvement in hot lead response time from automated scoring and real-time notifications |
Campaign ROI Visibility | Real-time ROI tracking enables 25% improvement in budget allocation decisions and campaign optimization |
Cross-team Collaboration | 50% reduction in communication overhead between marketing and sales teams through shared lead visibility |
Data Accuracy | 90% improvement in campaign performance data accuracy through automated tracking vs manual compilation |
Decision Making Speed | 70% faster campaign optimization decisions through real-time performance dashboards |
Cost Management | 30% improvement in budget control and prevention of campaign overspend through automated monitoring |
Lead Conversion Rate | 20% improvement in lead conversion through better lead scoring and prioritization |
Reporting Efficiency | 85% reduction in manual reporting effort through automated dashboard generation and exports |
Campaign Scalability | Ability to manage 3x more campaigns simultaneously with same team size through process automation |
12. User Behavior Tracking
Marketing Manager Tracking Plan
Metric | Events to Track | Properties | Insights Provided |
|---|---|---|---|
Dashboard Usage | Page view, Filter application, Date range changes | User ID, Campaign ID, Time spent, Filters used | Understanding which metrics are most important for decision making |
Campaign Analysis Depth | Drill-down clicks, Tab navigation, Performance comparisons | Campaign viewed, Segments analyzed, Time spent per section | Identifying most valuable analysis patterns for dashboard optimization |
Report Generation | Export clicks, Report scheduling, Data downloads | Export format, Frequency, Recipients | Understanding reporting needs and automation opportunities |
Questions Answered:
How do Marketing Managers consume performance data?
Which metrics drive the most decision-making activity?
What reporting cadence is most valuable?
Campaign Specialist Tracking Plan
Metric | Events to Track | Properties | Insights Provided |
|---|---|---|---|
Campaign Creation Flow | Step completion, Time per step, Abandonment points | Campaign type, Template used, Segments selected | Identifying bottlenecks in campaign setup process |
Content Management Usage | Template access, Edit frequency, Performance reviews | Template ID, Modification type, Performance impact | Understanding content optimization patterns and template effectiveness |
Real-time Monitoring | Refresh frequency, Alert responses, Metric checks | Metrics viewed, Time intervals, Response actions | Optimizing real-time monitoring features and alert thresholds |
Questions Answered:
Where do Campaign Specialists spend most time in campaign management?
Which features are most critical for operational efficiency?
How can campaign creation be streamlined?
Sales Manager Tracking Plan
Metric | Events to Track | Properties | Insights Provided |
|---|---|---|---|
Lead Prioritization | Hot lead access, Lead scoring reviews, Contact attempts | Lead ID, Score threshold, Response time | Understanding lead qualification criteria and how quickly sales teams respond to leads |
Campaign Attribution Analysis | Lead source reviews, Conversion tracking, Pipeline analysis | Campaign source, Conversion rates, Deal values | Measuring marketing campaign effectiveness and its direct impact on sales outcomes |
Follow-up Effectiveness | Contact frequency, Method used, Conversion results | Lead ID, Contact method, Outcome | Optimizing lead nurturing strategies and improving overall conversion processes |
Questions Answered:
How effectively do Sales Managers convert marketing-qualified leads?
Which campaigns produce the highest quality leads?
What lead scoring thresholds optimize conversion rates?
Link - https://preview--crmcopy1.lovable.app/contacts
No Comments