Service Order Dashboard : User Story (WX03US03)
1. Problem Statement
User Role: O&M Manager
Pain Points:
- Lack of real-time visibility into service order performance metrics and operational bottlenecks
- Inability to track SLA compliance across different service order types and priorities
- Limited insight into cost trends and budget variance for service operations
- Challenges in proactive decision-making due to scattered data across multiple systems
Core Problem
Service organizations struggle with effectively monitoring, managing, and optimizing their service order operations due to fragmented data visibility, resulting in declining SLA performance, increased customer dissatisfaction, and suboptimal resource utilization.
2. Who Are the Users Facing the Problem?
O&M Manager: Responsible for overseeing operations and maintenance activities, ensuring SLA compliance, managing resource allocation, and optimizing operational efficiency across service delivery teams.
3. Jobs To Be Done
For O&M Manager: When I need to monitor and optimize service order operations across my organization, But I lack real-time visibility into performance metrics, SLA compliance and operational bottlenecks scattered across multiple systems, Help me access a comprehensive dashboard that consolidates all critical service order metrics with real-time updates and actionable insights, So that I can make data-driven decisions to improve SLA performance, optimize resource allocation, and enhance overall operational efficiency.
4. Solution
Comprehensive Service Order Dashboard with Real-time Performance Monitoring
4.1 Performance Metrics Overview
- Real-time KPI tracking with visual indicators for critical metrics (1,247 orders, 45 overdue, 4.2 hrs average resolution, $284,750 cost)
- Trend analysis with percentage changes and visual status indicators
4.2 Service Order Management
- Multi-status tracking (created, Overdue, In Progress, Completed) with color-coded status indicators
- Quick action buttons for common operations
4.3 SLA Performance Analytics
- Real-time SLA compliance tracking with percentage metrics
- Historical trend visualization with monthly/quarterly comparisons
- Breach analysis
4.4 Service Order Source Analysis
- Multi-channel tracking with volume metrics
- Source-wise performance comparison and efficiency analysis
4.5 Cost Management and Trends
- Monthly service order cost tracking with budget variance analysis
- Cost per order (month ) metrics with trend visualization
4.6 Recent Activity Monitoring
- Real-time service order listing with status, customer, technician, and completion tracking
- Priority-based color coding and urgency indicators
- Quick access to detailed order information
4.7 Quick Actions and Workflow Management
- Direct access to create new service orders, schedule maintenance, assign urgent tasks
5. Major Steps Involved
For O&M Manager:
5.1 Dashboard Access and Overview
- Log into SMART360 system and navigate to Service Order Dashboard
- Review high-level KPI metrics in the top summary cards
- Assess overall operational health through color-coded status indicators
- Identify immediate attention items through red/orange alerts
5.2 Performance Analysis
5.3 Operational Monitoring
- Examine Service Orders by Source to understand workload distribution
- Review Monthly Service Order Cost trends for budget management
- Analyze Recent Service Orders for real-time operational status
5.4 Decision Making and Actions
- Identify bottlenecks through overdue orders and SLA violations
- Access Quick Actions panel for immediate interventions
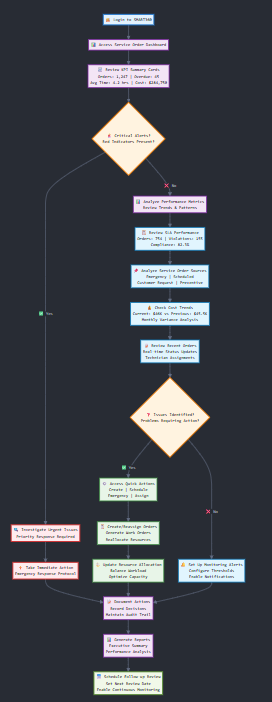
6. Flow Diagram
7. Business Rules
7.1 Dashboard Data and Calculations
KPI Summary Cards:
- Total Orders (1,247): Real-time count of all service orders ( month )
- Overdue Orders (45): Count of orders where current_date > creation_date AND status ≠ 'Completed', displayed with red indicator
- Average Resolution Time (4.2 hrs): Calculated as SUM(completion_date - creation_date) / COUNT(completed_orders) for completed orders in time period
- Total Cost ($284,750): SUM(labor_cost + material_cost + equipment_cost) for all orders in selected period ( month )
Service Orders Status Distribution:
- created: COUNT of orders created
- Overdue: COUNT of orders overdue
- Assigned: COUNT of orders WHERE status = 'In Progress' OR status = 'Assigned'
- Completed: COUNT of orders WHERE status = 'Completed'
SLA Performance Metrics:
- SLA Orders (754): COUNT of orders with defined SLA requirements complted within time period
- SLA Violations (155): COUNT of orders WHERE (completion_date - creation_date) > sla_target_time OR current_date > sla_due_date
- SLA Compliance (82.3%): Calculated as ((SLA Orders - SLA Violations) / Total SLA Orders) × 100
- Monthly SLA Trend: Monthly aggregation of SLA compliance percentage with green/red trend indicators
Service Orders by Source:
- Total order : total number of service orders recivied from other - meter, consumer , asset.
- from 3 sources (84%) : how much these 3 sources take from the total service orders that have been created in disptacher
Monthly Service Order Cost:
- Current Month ($46K): SUM of all order costs for current month
- Previous Month ($45.5K): SUM of all order costs for previous month
- Trend Line: Monthly cost aggregation over 6-month period with trend visualization
- Variance Calculation: ((Current Month - Previous Month) / Previous Month) × 100
Status Color Coding Rules:
- Completed: Green background
- In Progress: Blue background
- Pending: Orange background
- Overdue: Red background (when current_date > planned_completion_date)
8. Sample Data
KPI Summary Sample Data
Total Orders: 1,247 (↑ 12% from last period)
Overdue Orders: 45 (↑ 8% - Red indicator)
Average Resolution Time: 4.2 hours (↓ 0.3 hrs improvement)
Total Cost: $284,750 (↑ 15% from budget)
Service Orders Status Sample Data
Last 7 Days: 156 orders
Overdue: 45 orders (Red status)
In Progress: 89 orders (Blue status)
Completed: 1,113 orders (Green status)
SLA Performance Sample Data
Total Orders with SLA: 754
SLA Violations: 155
SLA Compliance: 82.3%
Target SLA: 95%
Monthly Trend: [85%, 81%, 82%, 84%, 82.3%]
Recent Service Orders Sample Data
Order ID | Customer | Type | Technician | Status | Scheduled
WO-2024-001 | City Water Dept | Installation | John Smith | Completed | 2024-06-01
WO-2024-002 | ABC Manufacturing | Repair | Sarah Johnson | In Progress | 2024-06-01
WO-2024-003 | Metro Hospital | Emergency | Mike Wilson | Pending | 2024-06-01
WO-2024-004 | Local School | Maintenance | David Brown | Overdue | 2024-05-30
Cost Trend Sample Data
Monthly Costs (Last 6 months):
January: $42,500
February: $38,750
March: $41,200
April: $44,100
May: $45,500
June: $46,000 (Current)
9. Acceptance Criteria
- The system must display real-time KPI summary cards showing total orders, overdue orders, average resolution time, and total cost with percentage change indicators.
- add filters of - 30 days, 60 days and 90 days in the cards.
- The system must provide color-coded status indicators for all KPI metrics (green for good, orange for warning, red for critical).
- The system must show service order distribution across four categories: created, Overdue, assigned, and Completed
- The system must display SLA performance metrics including total orders, breached sla, and compliance percentage with visual trend indicators.
- The system must provide a horizontal bar chart showing service orders by source with counts and percentages.
- The system must display monthly service order cost trends with current vs. previous month comparison and percentage variance.
- The system must show a real-time table of recent service orders with So ID, so name, status, piority, and Scheduled date.
- The system must provide quick action buttons for Create Service Order,create sop,view fielld technincian,bulk assign
- The system must apply appropriate color coding to order statuses (Green for Completed, Blue for In Progress, Orange for Pending, Red for Overdue).
- The system must calculate average resolution time only for completed orders within the selected time period.
- The system must aggregate costs from labor, material, and equipment cost components for total cost calculation.
- The system must calculate SLA compliance as percentage of orders meeting their SLA targets within the time period.
- The system must detailed order lists.
10. Process Changes
Current Process | New Process |
|---|---|
From: Manual compilation of service order reports from multiple systems taking 2-3 hours daily To: Real-time dashboard with automated KPI calculation and refresh | Impact: 85% reduction in manual reporting time, enabling focus on analysis and decision-making |
From: Weekly SLA performance reviews based on exported data To: Real-time SLA monitoring with automatic alerts for violations | Impact: 50% improvement in SLA compliance through proactive issue identification |
From: Reactive resource allocation based on phone calls and emails To: Proactive resource management using real-time workload distribution analytics | Impact: 30% improvement in technician utilization and 25% reduction in emergency overtime |
From: Monthly cost analysis from accounting reports To: Real-time cost tracking with budget variance monitoring | Impact: 40% faster budget variance identification enabling prompt corrective actions |
From: Manual escalation of overdue orders through supervisor notifications To: Automated overdue order identification with priority-based highlighting | Impact: 60% reduction in overdue order resolution time through immediate visibility |
From: Quarterly operational reviews using historical data To: Continuous performance monitoring with trend analysis | Impact: 70% improvement in operational decision speed and accuracy |
From: Separate access to different systems for order management To: Unified dashboard with integrated quick actions | Impact: 45% reduction in system navigation time and improved operational efficiency |
11. Impact from Solving This Problem
Metric Category | Improvement Description |
|---|---|
Operational Efficiency | 35% reduction in time spent on manual data compilation and reporting tasks |
SLA Performance | 25% improvement in SLA compliance through proactive monitoring and faster issue resolution |
Resource Utilization | 30% better technician allocation and 20% reduction in idle time through real-time workload visibility |
Cost Management | 15% reduction in operational costs through better budget monitoring and variance control |
Response Time | 40% faster identification and resolution of overdue orders and critical issues |
Decision Making | 50% improvement in data-driven decision speed through consolidated real-time insights |
Customer Satisfaction | 20% improvement in customer satisfaction due to better service delivery and reduced delays |
Reporting Efficiency | 85% reduction in manual reporting efforts with automated dashboard generation |
Compliance Monitoring | 60% improvement in regulatory compliance tracking and documentation |
Predictive Planning | 45% better forecasting accuracy through historical trend analysis and pattern recognition |
12. User Behavior Tracking
For O&M Manager
Event Name | Properties Tracked | Metrics/Insights |
|---|---|---|
dashboard_view | timestamp, user_id, session_duration, widgets_viewed | Questions Answered: How frequently is the dashboard accessed? Which widgets receive most attention? What's the average session duration? |
kpi_card_click | kpi_type, current_value, timestamp, drill_down_action | Questions Answered: Which KPIs are most important to users? How often do users drill down for details? |
filter_applied | filter_type, filter_value, timestamp, results_count | Questions Answered: What filtering patterns do managers use? Which time periods are most commonly analyzed? |
quick_action_used | action_type, timestamp, success_status, order_created | Questions Answered: Which quick actions are most valuable? What's the success rate of dashboard-initiated actions? |
alert_interaction | alert_type, severity, response_time, action_taken | Questions Answered: How quickly do managers respond to alerts? Which alert types drive immediate action? |
export_generated | export_format, data_range, timestamp, file_size | Questions Answered: What reporting needs exist beyond the dashboard? How is data being shared with stakeholders? |
sla_violation_viewed | violation_count, order_types, response_action, timestamp | Questions Answered: How do managers respond to SLA issues? Which violation types require immediate attention? |
cost_trend_analyzed | trend_period, variance_percentage, drill_down_performed | Questions Answered: How often are cost trends reviewed? What variance levels trigger deeper analysis? |
Key Questions Being Answered:
- Usage Patterns: How effectively is the dashboard being used for operational management?
- Performance Impact: Are users able to identify and resolve issues faster with the dashboard?
- Feature Adoption: Which dashboard features provide the most value to operational managers?
- Decision Effectiveness: How does dashboard usage correlate with improved operational outcomes?
- Training Needs: Where do users struggle or spend excessive time, indicating need for additional training?
- System Optimization: Which features should be enhanced or repositioned based on usage patterns?
wireframe - https://preview--service-flow-insight-hub.lovable.app/
1 Comment
Count of orders where current_date > creation_date AND status ≠ 'Completed', displayed with red indicator -> correct the formula
Calculated as SUM(completion_date - creation_date) / COUNT(completed_orders) for completed orders in time period -> Mention the time period in for every card or globally
SLA Compliance (82.3%): Calculated as ((SLA Orders - SLA Violations) / Total SLA Orders) × 100 -> remove this
from 3 sources (84%) : how much these 3 sources take from the total service orders that have been created in disptacher -> This metric is not required
Variance Calculation: ((Current Month - Previous Month) / Previous Month) × 100 -> Couldnt find this metric in the wireframe
Did not mention what the quick-action buttons should do
No mention of search bar and results fetched from the search
Provide formulas for all the percentage changes you have mentioned in the wireframe
impact analysis column is empty in process changes
Mention about filters provided in every card