Utility Admin Dashboard (ONB02US01)
1. Problem Statement
User Role: Utility Administrator
Pain Points:
- Lack of a centralized interface to view utility-specific details across different modules (CX, BX, MX, WX)
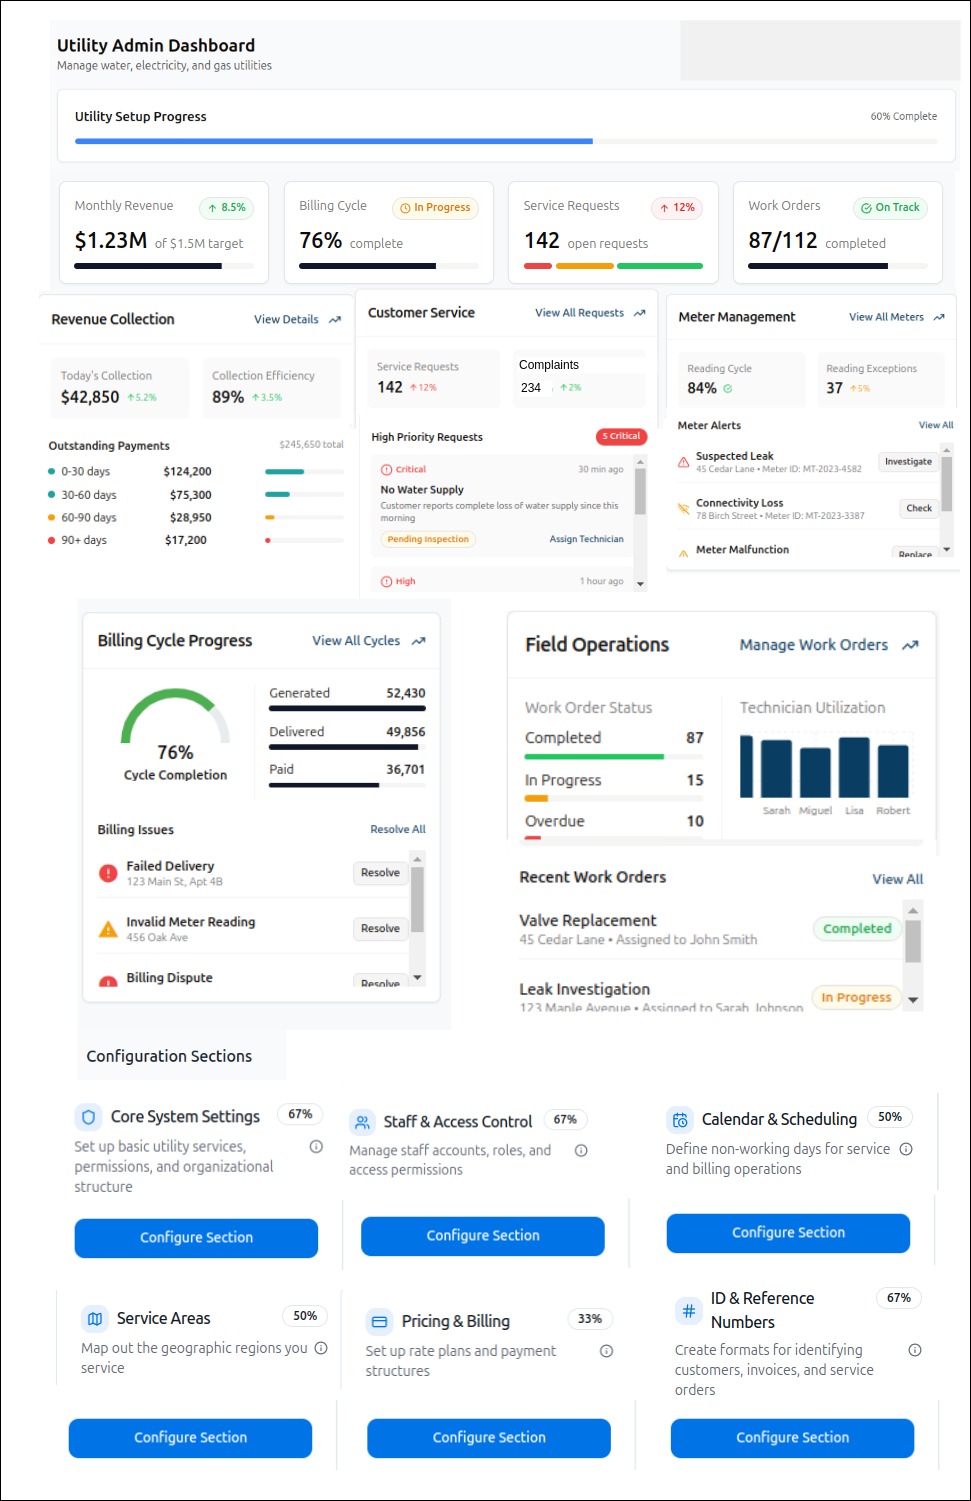
- Inability to track progress of utility setup and configuration (currently showing 60% complete overall but with varying progress in individual configuration sections)
- Difficulty in monitoring configurations, troubleshooting issues, and ensuring seamless utility operations
- Fragmented visibility into critical metrics across revenue collection, billing cycles, service requests, and work orders
- Challenge in prioritizing configuration tasks with no clear indication of dependencies or critical paths
Core Problem
Utility administrators in Smart360 lack integrated tools to efficiently manage and monitor utility configurations across multiple modules. This fragmentation leads to inefficiencies in setup, maintenance, and troubleshooting, ultimately affecting service delivery and operational performance.
2. Who Are the Users Facing the Problem?
Utility Administrator
- Responsible for managing water, electricity, and gas utilities configuration and operation
- Oversees setup progress across multiple configuration sections (Core System Settings, Staff & Access Control, Pricing & Billing, etc.)
- Monitors operational metrics including revenue collection, billing cycles, service requests, and work orders
- Handles configuration of utility services, permissions, and organizational structure
- Requires access to all feature areas of the dashboard for comprehensive utility management
3. Jobs To Be Done
For Utility Administrator: When I need to monitor the overall progress of utility setup and configuration, But I lack a centralized view that shows dependencies and relationships between configuration sections, Help me visualize configuration progress with interdependencies and priority indicators, So that I can efficiently complete the utility setup process and understand which areas need immediate attention.
For Utility Administrator: When I need to troubleshoot issues across different modules (CX, BX, MX, WX), But I have no unified interface to correlate problems between modules, Help me access a comprehensive view that connects related issues across modules, So that I can quickly identify root causes and resolve issues affecting multiple areas.
For Utility Administrator: When I need to ensure all critical configuration sections are properly set up, But I cannot easily determine the impact of incomplete configurations on operational performance, Help me understand the relationship between configuration completion and key performance metrics, So that I can prioritize configuration tasks that will have the greatest positive impact on operations.
For Utility Administrator: When I need to respond to critical alerts and service disruptions, But I struggle to connect these issues to specific configuration settings, Help me trace operational issues back to their configuration sources, So that I can make targeted adjustments to prevent recurring problems.
For Utility Administrator: When I need to optimize billing and revenue collection processes, But I can't easily identify configuration gaps affecting financial performance, Help me connect billing issues and revenue metrics to specific configuration areas, So that I can fine-tune configuration settings to improve financial outcomes.
4. Solution
Comprehensive Solution Description
The solution is an enhanced Utility Admin Dashboard that provides a centralized, holistic view of utility configuration and operations. It enables administrators to monitor progress, identify dependencies, troubleshoot issues across modules, and optimize performance through targeted configurations.
Key Capability Areas
1. Configuration Progress Tracking
- Visual progress tracker with dependency mapping between configuration sections
- Critical path identification for essential configuration tasks
- Automated recommendations for next configuration steps based on current status
2. Cross-Module Integration
- Unified view of related data across CX, BX, MX, and WX modules
- Correlation engine to connect issues across different operational areas
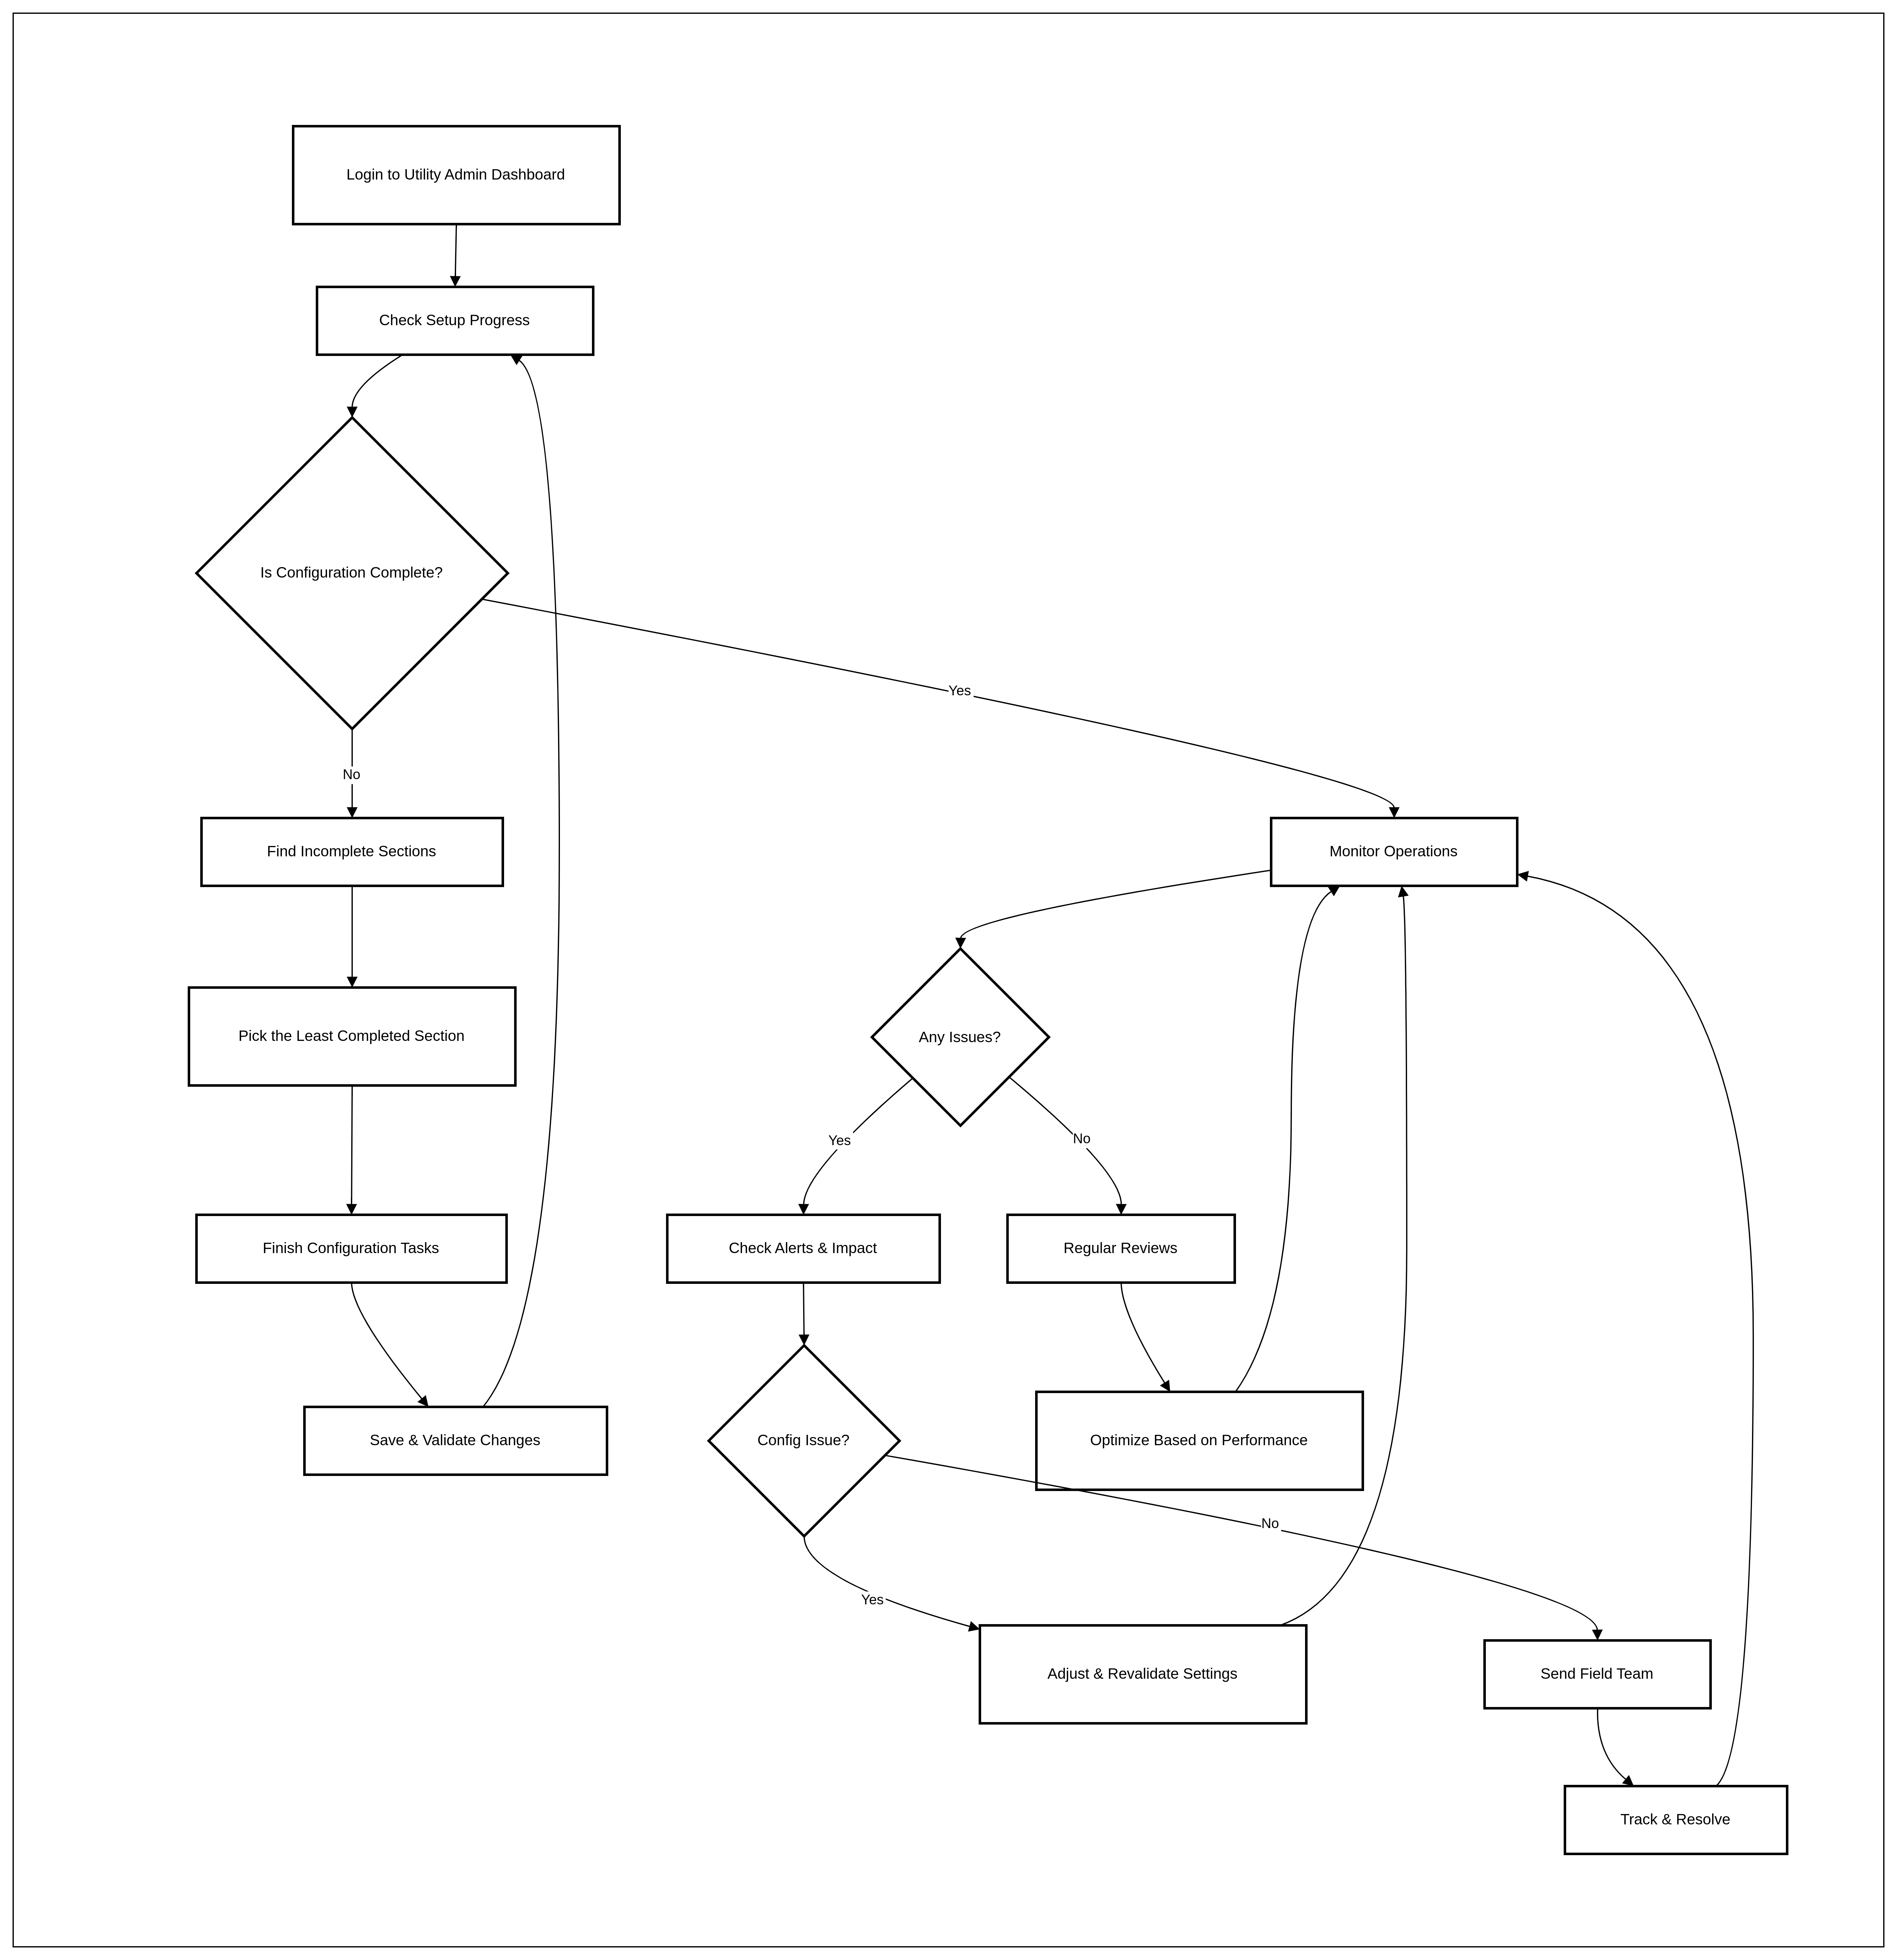
5. Major Steps Involved
Utility Administrator: Completing Initial Configuration Setup
- Log into the Smart360 platform and navigate to the Utility Admin Dashboard
- View the overall Utility Setup Progress indicator (currently at 60%)
- Identify configuration sections with the lowest completion percentages (Pricing & Billing at 33%, Service Areas and Calendar & Scheduling at 50%)
- Click "Configure Section" on the Pricing & Billing card
- Complete the rate plan setup and payment structure configuration
- Save changes and return to the dashboard
- Observe the updated completion percentage for Pricing & Billing and overall Utility Setup Progress
- Proceed to the next lowest completion section (Service Areas)
- Map the geographic regions for service coverage
- Save and return to dashboard
- Continue with Calendar & Scheduling configuration, defining non-working days
- Complete remaining configurations for Core System Settings, Staff & Access, and ID & Reference Numbers
- Review the overall Utility Setup Progress to ensure 100% completion
- Validate configuration by checking operational metrics (Revenue Collection, Billing Cycle, Service Requests, Work Orders)
6. Flow Diagram
7. Business Rules
General Configuration Rules
- Configuration changes must be validated against operational requirements before being applied
- All configuration changes must be logged with timestamp and admin identification
- Configuration settings cannot be deleted once operational data depends on them, only marked as inactive
Performance Metric Rules
KPI's
- Monthly Revenue Growth = (Current Month Revenue - Previous Month Revenue) / Previous Month Revenue × 100
- Billing Cycle Progress = (Completed Billing Tasks / Total Billing Tasks) × 100
- Service Requests = Total service requests
- Work orders = total completed workorder / Total workorders
Revenue collection
- Collection Efficiency = (Total Amount Collected / Total Billable Amount) × 100
- Daily Collection = Total Monthly Collection ÷ Number of Working Days
- Total Outstanding = Sum of amounts in each aging bucket (0-30, 30-60, 60-90, 90+ days)
- Aging Bucket Percentage = (Amount in Specific Bucket / Total Outstanding) × 100
Coustomer service:
- Service request = total number of service request
- Request Volume Growth = (Current Open Requests - Previous Open Requests) / Previous Open Requests × 100
- Total complaints = Number of total complaints
- Complaint Resolution Rate = (Resolved Complaints / Total Complaints) × 100
- Display the high priority request
Work Orders Formulas:
- Work Order Completion Rate = (Completed Work Orders / Total Work Orders) × 100
Meter Management Formulas:
- Reading Cycle Completion = (Completed Readings / Total Scheduled Readings) × 100
- Alert Rate = (Total Meter Alerts / Total Meters) × 100
- Display the error messages related to meter
Billing Cycle Progress Rules:
- Total Generated Bills: 52,430
- Delivered Bills: 49,856
- Paid Bills: 36,701
- Cycle Completion: 76% - total umber of cycles compare with completed cycles
- Calculation Rule: Progress tracked by ratio of completed to total billing tasks
- Display all billing related issues that occoured recently
Field Operations Rules: Work Order Status Tracking:
- Completed Work Orders: 87
- In Progress Work Orders: 15
- Overdue Work Orders: 10
- Display the recent 5 workorders with the name, assigne, and status
Configuration section
- Display all the configuration sections with respect to its completion percentage
- On Configure navigate to the cofigure section for selceted Card
8. Acceptance Criteria
- The system must display overall utility setup progress as a percentage with visual indicators
- The system must break down configuration completion by section with individual progress percentages
- The system must allow direct navigation to any configuration section via "Configure Section" buttons
- The system must display operational metrics related to completed configurations
- The system must log all configuration changes with timestamp and user information
9. Process Changes
| Category | Current Approach | Optimized Approach | Expected Impact |
|---|---|---|---|
Configuration Management | Manual tracking of configuration status across separate sections | Centralized dashboard with unified progress tracking | 70% reduction in monitoring time; increased visibility across all utility aspects |
Utility Setup | Ad-hoc configuration without clear prioritization | Structured, guided setup with clear dependencies and critical path | 40% faster utility onboarding; more consistent configuration quality |
Knowledge Transfer | Siloed expertise in specific configuration areas | Centralized knowledge base with contextual guidance | Reduced dependency on specialized staff; 45% faster onboarding of new administrators |
11. Impact from Solving This Problem
| Metric | Improvement | Justification |
|---|---|---|
✅ Utility Setup Time | 40% reduction | Centralized configuration tracking and clear dependencies eliminate wasted effort and create a structured approach to setup |
✅ Configuration Quality | 35% improvement | Validation, and best practices ensure more consistent, high-quality configurations |
✅ Operational Efficiency | 25% improvement | Better configurations reduce service disruptions and administrative overhead |
✅ Administrative Productivity | 30% increase | Less time spent navigating between modules and troubleshooting configuration issues |
✅ Revenue Leakage | 15% reduction | Properly configured billing and meter systems reduce unbilled consumption and payment errors |
✅ Customer Satisfaction | 20% improvement | Fewer service disruptions and faster issue resolution improve the customer experience |
✅ Training Time for New Admins | 50% reduction | Contextual help and intuitive configuration interfaces reduce learning curve |
12. User Behavior Tracking
Events to Track for Utility Administrator
| Event | Properties Captured | Metrics | Insights Generated |
|---|---|---|---|
Configuration Section Opened |
,
,
| Frequency, Duration, Completion Rate | Which configuration areas require the most attention? Are admins struggling with specific sections? |
Configuration Change Made |
,
,
,
,
| Change Frequency, Error Rate, Revision Count | Are configurations stable or frequently changing? Which fields cause the most validation errors? |
Configuration Dependency Followed |
,
,
| Flow Efficiency, Path Adherence | Are admins following optimal configuration paths? Are dependencies clear and logical? |
Alert-to-Configuration Navigation |
,
,
,
| Response Time, Resolution Rate, Configuration Impact | How effectively are alerts driving configuration improvements? |
Configuration Template Applied |
,
,
| Template Usage, Customization Rate | Are templates saving time? Which templates are most valuable? |
Configuration Health Score Viewed |
,
,
| Review Frequency, Action Rate | Does the health score drive improvement actions? |
Configuration Help Accessed |
,
,
| Help Utilization, Topic Popularity | Which configuration areas need better documentation or training? |
Cross-Module Navigation |
,
,
,
| Navigation Efficiency, Task Completion | Is cross-module integration saving time and improving problem-solving? |
Questions Answered by Tracking Data
- Which configuration areas cause the most difficulty for administrators?
- Does configuration completion correlate with improved operational metrics?
- Are administrators following optimal configuration sequences?
- Which configuration changes have the most positive impact on performance?
- Are templates and guided workflows reducing configuration time and errors?
- Do administrators understand the relationships between different configuration sections?
- How quickly do administrators respond to configuration-related alerts?
- Which configuration help topics are most frequently accessed?
- Are administrators able to efficiently navigate between related issues across modules?
- Does the configuration health score drive improvement actions?
13. Wireframe
14. Enhancement
Setup Progress
- Progress is based on the 6 configurations with each weightage of 16.6
- Core system settings
- Staff and access control
- Calendar and scheduling
- Service area
- Plans and tariffs
- ID’s and references
Below are the Cards with the progress items and indication:
Core system settings
- Utility Services - when users activate any one utility service then the system should mark it as configured,instead it should be pending
- Departments and Roles - When user selects any department then the system should mark it as configure, instead it should be pending
Staff and access control
- Invite Utility Admin - When an utility admin is invited from the invite user the system should mark it as configure, instead it should be pending.
- Invite 2 Users - When any 2 users are invited from the invite user the system should mark it as configure, instead it should be pending.
Calendar and scheduling
- Calendar holidays - When the user adds any holiday in the system then the system should mark it as configure, instead it should be pending.
- Working days - When the user sets up any working day the system should mark it as configure, instead it should be pending.
Service area
- Add 2 Sub areas - when a user adds 2 unique sub areas then the system should mark it as configured, instead it should be pending.
- Add 4 Premises - When a user adds 4 unique premises then the system should mark it as configured, instead it should be pending
Plans and tariffs
- Create a tariff - When a user creates a tariff then the system should mark it as configured, instead it should be pending.
- Create a Plan - When a user creates a plan then the system should mark it as configured, instead it should be pending.
ID’s and references
- Consumer account number - When the user sets or modifies the Consumer account number then the system should mark it as configured, instead it should be pending.
- Meter number - When the user sets or modifies the meter number then the system should mark it as configured, instead it should be pending.
Wireframe: https://preview--coresetting-updated.lovable.app/utilities/cityA
No Comments