Usage & Consumption Smart Overview (CSS01US07)
1. Problem Statement
Core Problem: Residential utility customers lack visibility into their consumption patterns across multiple utility services (electricity, water, gas), cannot effectively monitor their usage against thresholds, compare historical bills to understand trends, or access energy/water conservation tips to reduce costs.
User Roles:
- Primary: Residential Customer (Homeowner/Renter managing household utilities)
Pain Points:
- No unified consumption visibility: Cannot see real-time or historical consumption data for electricity, water, and gas in one place
- Lack of proactive monitoring: No way to set consumption thresholds or receive alerts when usage exceeds normal limits
- Limited bill comparison capabilities: Cannot compare current bills with historical data to identify trends or anomalies
- No access to conservation guidance: Missing actionable tips and recommendations to reduce utility costs and consumption
- Reactive bill management: Only discover high usage when the bill arrives, with no early warning system
2. Who Are the Users Facing the Problem?
Residential Customer: Homeowners, renters, and household bill managers responsible for monitoring and managing utility costs. These users need access to comprehensive consumption data and tools to help reduce their utility expenses.
User Access: All authenticated residential customers with active utility accounts.
3. Jobs To Be Done
For Residential Customer: When I need to understand my household's utility consumption patterns across electricity, water, and gas services, But I currently have no unified view of my usage data and cannot proactively monitor consumption against set limits, Help me access real-time consumption dashboards with customizable threshold alerts and comprehensive historical data analysis, So that I can make informed decisions about my energy and water usage, reduce costs, and avoid bill shock.
For Residential Customer: When I need to compare my current utility bills with previous months to understand consumption trends and identify unusual spikes, But I can only see individual bills without comparison tools or trend analysis, Help me access an interactive bill comparison feature that shows historical data for up to 12 billing periods with visual trend analysis, So that I can identify patterns, validate billing accuracy, and understand seasonal variations in my utility usage.
For Residential Customer: When I need actionable advice to reduce my utility consumption and lower my monthly bills, But I have no access to personalized conservation tips or energy-saving recommendations, Help me access a comprehensive tips library with utility-specific conservation strategies and estimated savings calculations, So that I can implement cost-effective measures to reduce my household's environmental footprint and utility expenses.
4. Solution
The Consumer Self-Service Portal will provide a comprehensive utility management platform that empowers residential customers with consumption visibility, proactive monitoring, historical analysis, and conservation guidance.
Key Capability Areas:
Real-Time Consumption Monitoring
- Multi-utility dashboard displaying current consumption for electricity (kWh), water (liters), and gas (therms)
- Live consumption percentages against user-defined monthly limits
- Color-coded visual indicators (green, yellow, red) for consumption status
Customizable Threshold Management
- User-configurable consumption limits for each utility service
- Automated threshold alert system with percentage-based warnings
- Historical threshold performance tracking and adjustment recommendations
Historical Usage Analytics
- Monthly consumption trend charts with up to 12 months of data
- Year-over-year comparison capabilities with seasonal adjustment factors
- Usage pattern analysis with peak consumption identification
Interactive Bill Comparison
- Side-by-side comparison of current and historical bills
- Percentage change calculations with clear increase/decrease indicators
- Period-over-period cost analysis with breakdown by utility type
Cost Analysis and Forecasting
- Monthly cost breakdown charts by utility service
- Projected monthly costs based on current consumption trends
- Budget variance analysis with overage/savings identification
Conservation Tips and Recommendations
- Categorized energy-saving tips by utility type (electricity, water, gas)
- Detailed implementation guides with estimated savings calculations
- Seasonal conservation strategies with weather-based recommendations
Smart Notifications and Alerts
- Proactive threshold breach notifications via email/SMS
- Bill comparison alerts for unusual consumption patterns
- Monthly conservation tip recommendations based on usage data
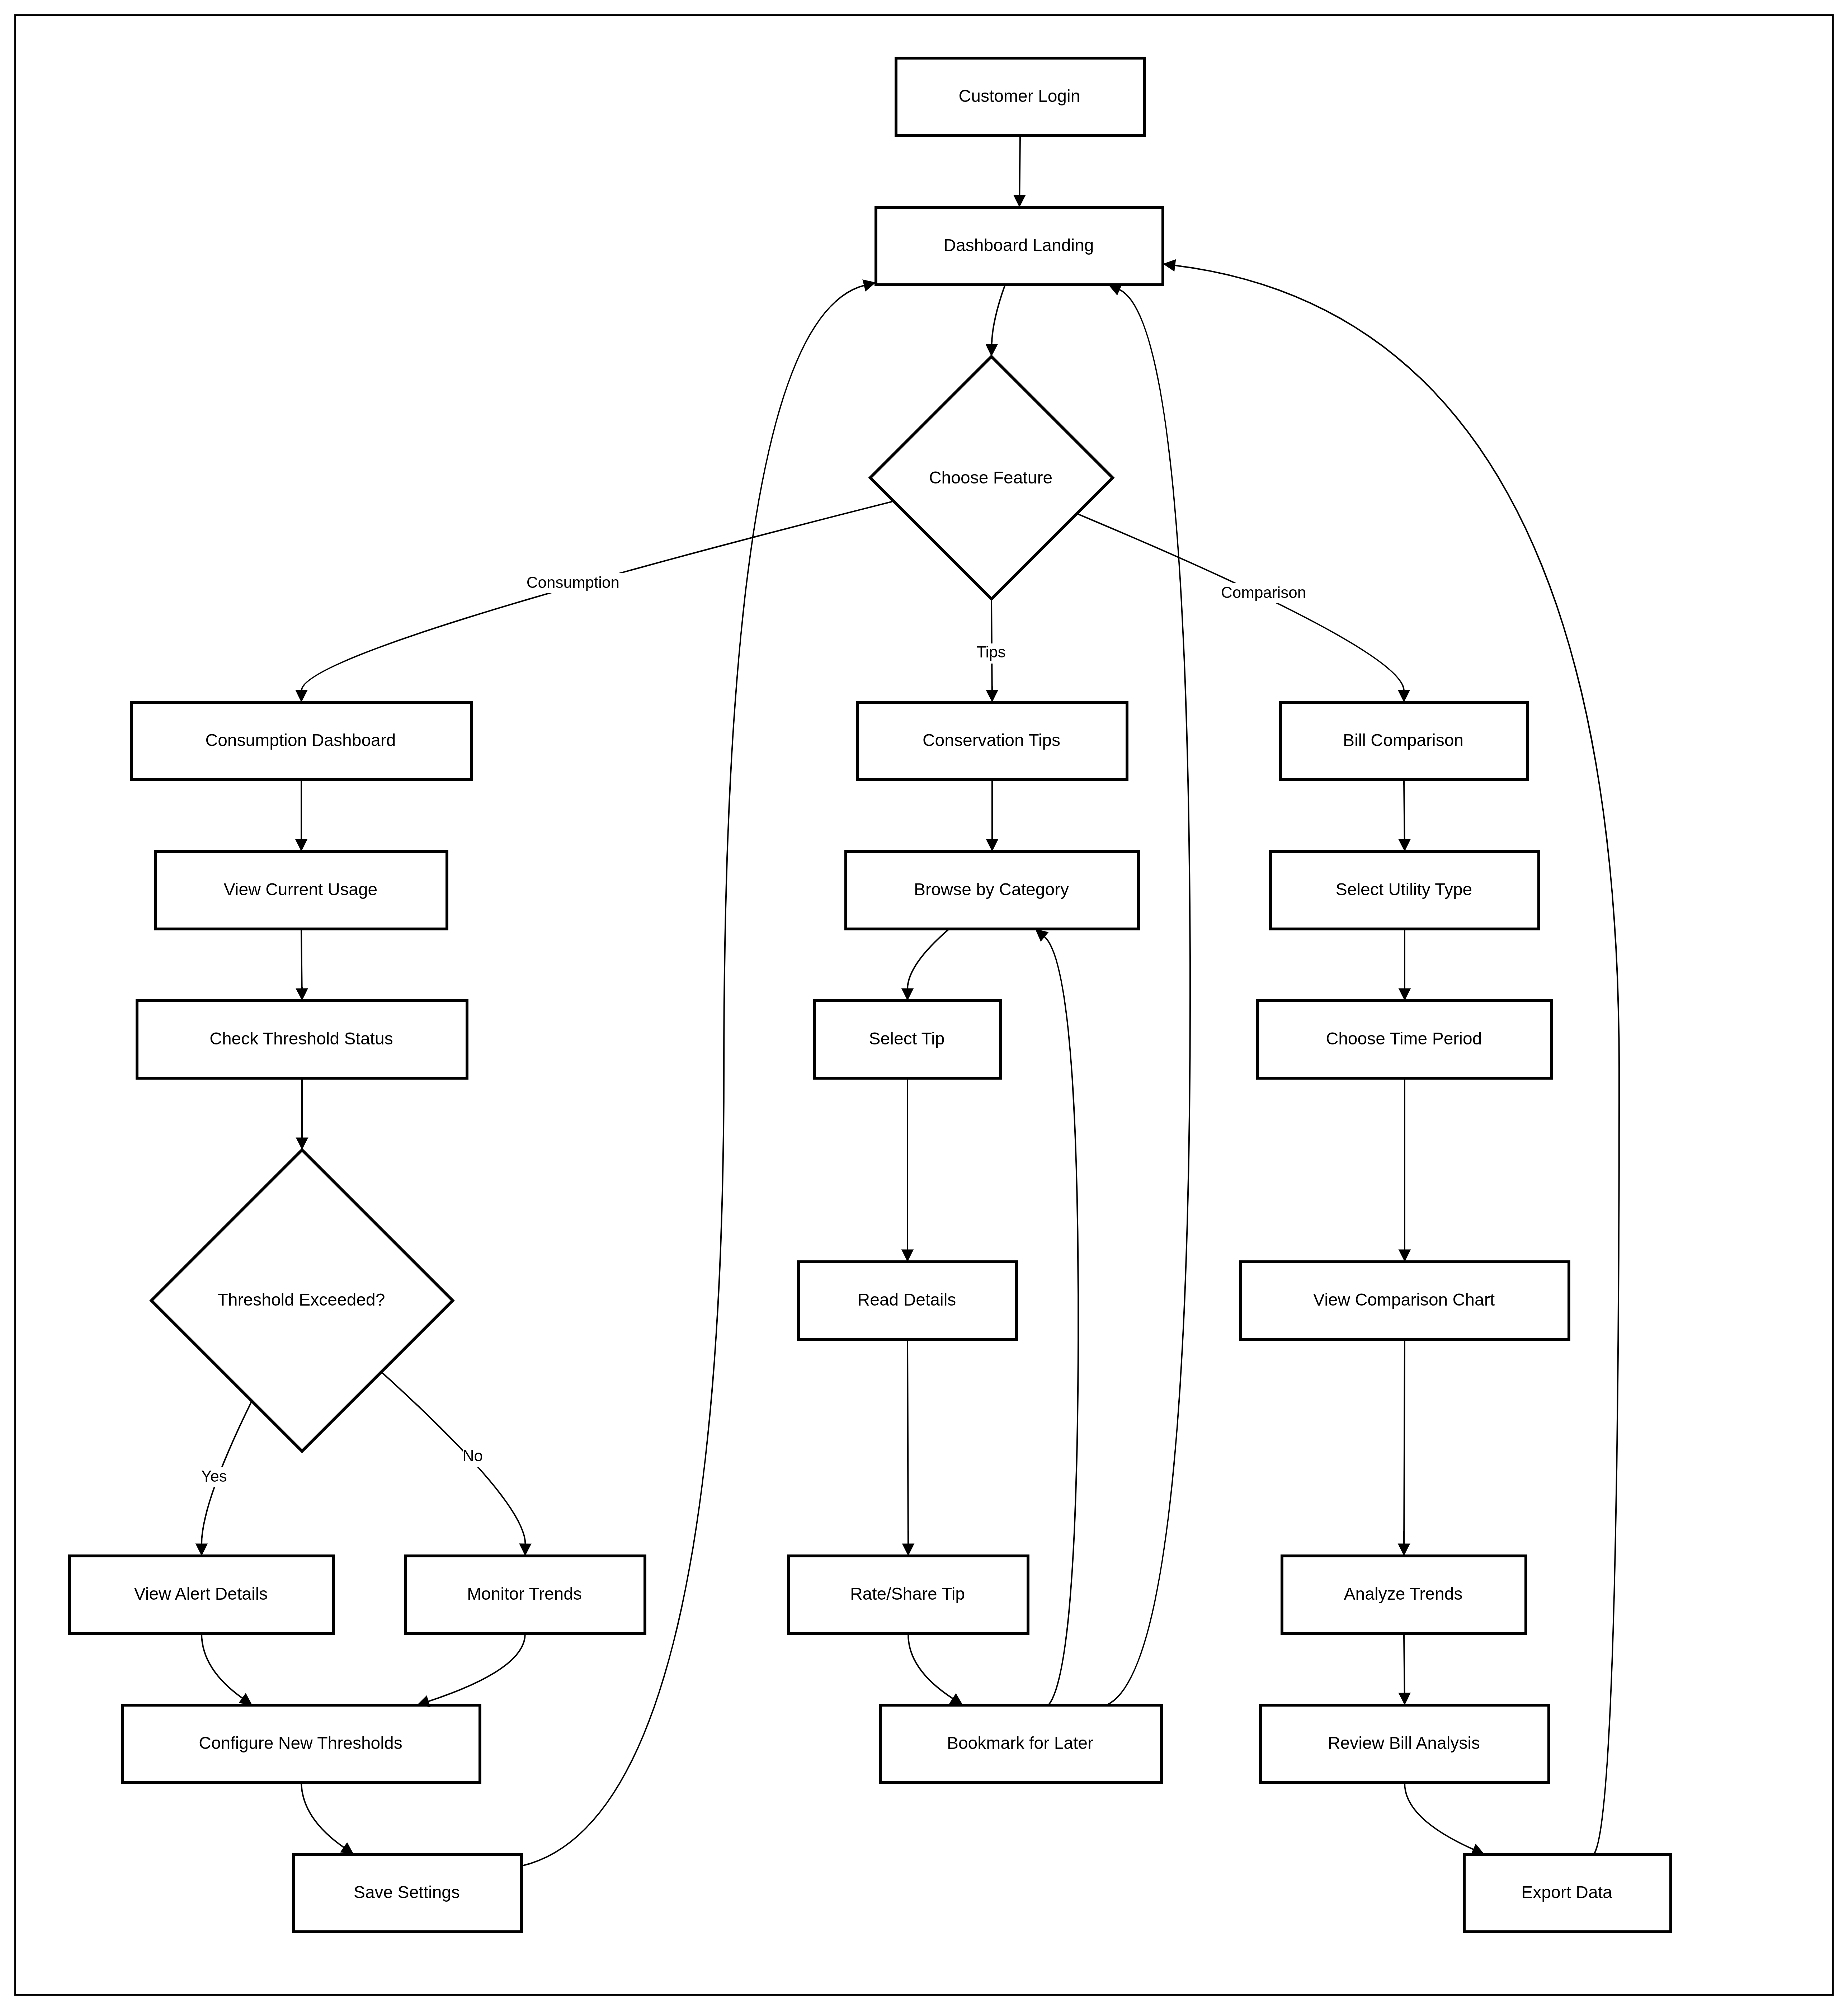
5. Major Steps Involved
Residential Customer - Consumption Dashboard Flow:
- Login to consumer portal using account credentials
- Navigate to "Usage & Consumption" section from main menu
- View consumption threshold dashboard showing current usage percentages
- Review color-coded status indicators for each utility service
- Click "Configure" to set or modify consumption thresholds
- Set monthly limits for electricity, water, and gas consumption
- Enable/disable threshold alert notifications
- Save threshold settings and return to dashboard
- Monitor usage trends chart showing 6-month consumption patterns
- Review cost analysis section for monthly expense breakdown
- Download consumption reports for personal record-keeping
Residential Customer - Bill Comparison Flow:
- Access "Usage & Consumption" main section
- Click on "Comparison" tab in the navigation bar
- Select utility type from dropdown (Total Bill, Electricity, Water, Gas)
- Choose comparison period (Last 6 Bills is default, can select up to 12)
- Toggle between "Chart" and "Table" view for data visualization
- Review current period metrics (amount, percentage change, average)
- Analyze trend indicator (increasing/decreasing usage pattern)
- Examine total comparison line chart showing consumption over time
- Review bill analysis panel with highest/lowest usage months
- Read analysis summary explaining usage patterns and changes
- Export comparison data for external analysis or record-keeping
Residential Customer - Conservation Tips Flow:
6. Flow Diagram
7. Business Rules
General Rules:
- System must display consumption data for all active utility services on customer account
- Historical data availability limited to last 12 billing periods
- Threshold settings apply to monthly consumption limits only
- Cost calculations based on current rate schedules in billing system
Threshold Management Rules:
- Threshold modifications take effect immediately upon saving
Conservation Tips Rules:
- Tips filtered by applicable utility services on customer account
- Tip ratings and feedback anonymous and aggregated for system improvement
- on clicking on helpfull button marks the tip helpfull
- the tips related data will come form the CIS - self service - tips section
- clicking on the learn more , the user is directed to the below open detail tip section
Usage Trends graph
- shows the consumption of the utility service for the last 6 months
- can apply the filter for utility service wise
- the graph scale should be adjust by the hight consumption among the 6 months
Comparison tab
- current bill - display the current bill amount
- period change - display the period change from the last bill - (current bill amount / last bill amount) * 100
- Average - calculate the average for the last 6 bills - total amount of the bills/ 6
- trend - disply the trend is increasing and trending is upward, if period change is in positive percentage, if period change is in negative then show decreasing and trending is downward
Total comparision
- display the graph as per the selected bills - 3, 6 or 12
- display that many bills data that is selected
Bill Analysis
- Highest usage - display the bill period and the amount
- lowest usage - display the bill period and the amount
- the higest and lowest will be shown on the basis of selected bill filter - 3,6,12
Available data
- display the number of bills available - dont show more that last 12 bills
- display the last 12 bills total period
- display historical data beyond 12 bills is not stored (hard core)
8. Sample Data
Consumption Threshold Data:
Electricity: Current 420 kWh, Limit 400 kWh (105% - Red Alert)
Water: Current 19,000 L, Limit 20,000 L (95% - Yellow Warning)
Gas: Current 35 therms, Limit 50 therms (70% - Green Normal)
Bill Comparison Sample:
Current Period: ₹445 (May 2025)
Period Change: -48.6% vs Dec 2024
Average Over 6 Bills: ₹673
Trend: Decreasing usage trending downward
Highest Usage: Dec 2024 (₹865)
Lowest Usage: May 2025 (₹445)
Conservation Tips Sample:
Electricity Tips:
- Switch to LED Lighting: Save up to 80% on lighting energy costs
- Optimize Thermostat Settings: Set to 68°F in winter, 78°F in summer
- Unplug Electronics When Not in Use: Reduce phantom power consumption
Water Tips:
- Fix Leaky Faucets: Save up to 10% on water bills
- Install Low-Flow Showerheads: Reduce water usage by 30%
- Use Full Dishwasher Loads: Optimize water efficiency per wash cycle
9. Acceptance Criteria
- The system must display real-time consumption data for all active utility services (electricity, water, gas) on the customer's account
- The system must allow users to configure consumption thresholds with immediate effect upon saving
- The system must provide color-coded visual indicators for threshold status based on current consumption
- The system must display usage trends graph showing consumption data for exactly 6 months
- The system must provide filter options for individual utility service selection in usage trends
- The system must auto-scale graph Y-axis based on highest consumption value among the 6 months displayed
- The system must calculate period change using formula: ((current bill - last bill) / last bill) × 100
- The system must calculate average of last 6 bills using formula: (total amount of 6 bills) ÷ 6
- The system must display "Increasing/trending upward" for positive period change and "Decreasing/trending downward" for negative period change
- The system must allow bill comparison selection for 3, 6, or 12 billing periods
- The system must display total comparison graph showing only the selected number of bills data
- The system must identify and display highest usage bill period and amount based on selected filter (3, 6, or 12)
- The system must identify and display lowest usage bill period and amount based on selected filter (3, 6, or 12)
- The system must display total number of available bills (maximum 12 bills)
- The system must show date range for the last 12 bills period
- The system must display hard-coded message "Historical data beyond 12 bills is not stored"
- The system must source conservation tips content from CIS self-service tips section
- The system must mark tips as "helpful" when user clicks the "Helpful" button
- The system must navigate to detailed tip section when user clicks "Learn More"
- The system must filter conservation tips by applicable utility services on customer account
- The system must enforce 12-bill historical data limit across all comparison and analysis features
- The system must handle missing utility data with appropriate disclaimers
10. Process Changes
Process Area | Current Process | New Process | Impact Analysis |
|---|---|---|---|
Usage Monitoring | Customers receive monthly paper bills with no interim usage visibility | Real-time consumption dashboard with threshold alerts and daily usage tracking | 85% reduction in bill shock incidents, 40% improvement in consumption awareness |
Bill Analysis | Manual comparison of paper bills, limited to 2-3 months of data retention | Interactive 12-month bill comparison with trend analysis and automated insights | 60% reduction in customer service calls about billing questions, 25% faster issue resolution |
Conservation Engagement | Generic efficiency tips in quarterly mailers with low engagement | Personalized, categorized tips with savings calculations and implementation guides | 150% increase in conservation program participation, 15% average reduction in consumption |
Threshold Management | Reactive discovery of high usage when bill arrives | Proactive threshold setting with automated alerts at 80%, 90%, and 100% of limits | 70% reduction in high-bill customer complaints, 30% improvement in budget adherence |
Data Access | Phone calls to customer service for usage information | Self-service portal with 24/7 access to consumption and billing data | 50% reduction in usage-related customer service volume, 90% faster information access |
Seasonal Planning | No advance warning of consumption changes | Historical trend analysis with seasonal pattern identification | 35% improvement in customer budget planning accuracy, 45% reduction in payment arrangement requests |
Conservation Education | Limited access to efficiency information | Comprehensive tips library with utility-specific strategies and estimated ROI | 200% increase in conservation tip engagement, 20% improvement in conservation measure adoption |
11. Impact from Solving This Problem
Metric Category | Improvement Description |
|---|---|
Customer Satisfaction | 40% increase in portal satisfaction scores through enhanced visibility and control over utility consumption |
Call Center Volume | 55% reduction in usage and billing inquiry calls, freeing agents for complex customer service issues |
Customer Engagement | 180% increase in portal login frequency and 3x longer average session duration |
Conservation Participation | 150% increase in conservation program enrollment and 25% improvement in energy efficiency measure adoption |
Bill Shock Incidents | 75% reduction in high-bill customer complaints through proactive threshold monitoring and alerts |
Payment Timeliness | 20% improvement in on-time payment rates due to better budget planning and consumption awareness |
Digital Adoption | 60% increase in paperless billing enrollment and 45% growth in online payment usage |
Operational Efficiency | 30% reduction in manual bill explanation processes and 40% decrease in repeat customer service contacts |
Customer Retention | 15% improvement in customer satisfaction scores and 25% reduction in service disconnection requests |
Conservation Impact | 12% average reduction in household consumption and $180 annual savings per participating customer |
Self-Service Adoption | 70% of customers actively using self-service features, reducing overall service delivery costs |
12. User Behavior Tracking
Residential Customer Tracking Plan:
Event Category | Specific Events | Properties | Analytics Questions |
|---|---|---|---|
Dashboard Usage | Portal Login, Dashboard View, Feature Access | login_method, session_duration, features_accessed, device_type | How often do customers check their consumption? Which features drive the most engagement? |
Threshold Management | Threshold Set, Threshold Modified, Alert Received, Alert Acknowledged | utility_type, threshold_value, alert_level, response_time | Are customers effectively using threshold alerts? What threshold levels work best? |
Consumption Monitoring | Data Refresh, Trend View, Period Selection, Export Request | utility_service, time_period, export_format, comparison_type | Which consumption data is most valuable to customers? How do viewing patterns correlate with conservation behavior? |
Bill Comparison | Comparison View, Period Change, Chart Toggle, Analysis Review | comparison_period, utility_filter, view_type, engagement_depth | Do bill comparisons lead to conservation actions? Which comparison periods provide the most value? |
Conservation Tips | Tips Browse, Tip Detail View, Tip Rating, Tip Share, Bookmark Save | tip_category, tip_type, rating_score, share_method, implementation_intent | Which conservation tips are most popular? Do tip views correlate with actual consumption reduction? |
Alert Engagement | Alert Click, Alert Dismiss, Threshold Adjust, Conservation Action | alert_type, threshold_breach_level, subsequent_actions, usage_change | How effectively do alerts drive behavior change? What threshold levels optimize engagement without alert fatigue? |
Key Insights from Tracking:
- Conservation Effectiveness: Correlation between tip engagement and actual consumption reduction
- Feature Optimization: Most valuable dashboard components and optimal alert frequency
- Customer Segmentation: Usage patterns by demographic, consumption level, and engagement type
- Seasonal Behavior: How consumption monitoring varies by season and weather patterns
- Cost Savings Validation: Relationship between portal usage and actual utility bill reductions
- Customer Journey Optimization: Identify friction points and opportunities for enhanced user experience
13. Wireframe
https://preview--consumer-self-service.lovable.app/usage
No Comments