Master Bill Viewer User Story (BX04US01)
1. Problem Statement
For Billing Manager:
- Lack of a centralized location to view, search, and manage all utility bills
- Inability to quickly access individual bills for audits, customer inquiries, or validation
- Limited filtering capabilities to identify specific bill subsets based on criteria
- No consolidated view of billing metrics and trends across different categories
- Difficulty tracking bill status changes and payment trends over time
- Time-consuming process to locate and review bills from different billing cycles
- Challenges in identifying billing anomalies or patterns without comprehensive data views
Core Problem:
The current billing system lacks a centralized, searchable repository of all generated bills with robust filtering and analytics capabilities. This forces Billing Managers to use inefficient, indirect methods to access bill information, resulting in delayed customer issue resolution, ineffective billing oversight, and missed opportunities for process optimization.
2. Who Are the Users Facing the Problem?
Billing Manager:
- Oversees entire billing cycle from meter data import to bill delivery
- Manages billing exception processes and adjustments
- Coordinates with meter department on reading schedules
- Oversees payment processing and reconciliation
- Develops bill formats and customer communications
- Reports on revenue and billing performance metrics
- Ensures compliance with regulatory requirements for billing
- Investigates and resolves billing complaints and inquiries
3. Jobs To Be Done
For Billing Manager:
- When I need to locate a specific customer bill based on multiple criteria, But I lack a centralized searchable repository, Help me access a comprehensive bill viewer with advanced search and filtering capabilities, So that I can quickly find any bill without switching between multiple systems or contacting support teams.
- When I need to investigate billing anomalies or patterns across customer segments, But I have limited visibility into aggregated billing data, Help me access dashboards with key billing metrics and trend indicators, So that I can identify unusual patterns, make data-driven decisions, and proactively address potential issues.
- When I need to respond to customer inquiries about specific bills, But I struggle to quickly access complete bill information, Help me view and download individual bills with full details, So that I can provide timely and accurate information to resolve customer concerns.
- When I need to audit billing accuracy across different cycles or customer types, But I lack efficient ways to analyze and compare multiple bills, Help me generate filtered views and export capabilities for bill subsets, So that I can perform comprehensive audits and ensure billing accuracy.
- When I need to monitor bill delivery and payment status across the customer base, But I don't have visibility into overall bill statuses, Help me access real-time status tracking with clear visual indicators, So that I can identify payment trends and follow up on problematic accounts.
4. Solution
The Master Bill Viewer provides a comprehensive solution for centralized bill management and analysis:
Key Capability Areas:
- Dashboard & Summary Metrics
- Billing summary cards with key metrics (total bills, consumption, bill counts)
- Financial summary metrics (billed amount, outstanding amount, charge breakdowns)
- Trend indicators showing changes from previous period
- Visual representations of key metrics for quick analysis
- Advanced Search & Filtering
- Full-text search across all bill attributes
- Multi-criteria filtering options (date ranges, consumer types, bill cycles)
- Saved search templates for frequent queries
- Type-ahead suggestions for faster searching
- Bill Listing & Management
- Sortable and customizable column display
- Status indicators with color coding (delivered, paid, partially paid, overdue)
- Pagination with adjustable records per page
- Quick action buttons for common operations
- Individual Bill Access
- View complete bill details including line items
- Download bill in multiple formats (PDF, CSV)
- Access to billing calculation history
- Bill verification and audit trail information
- Batch Operations
- Select multiple bills for bulk actions
- Mass status updates for selected bills
- Batch export of bill data
- Scheduled report generation for bill sets
- Analytics & Reporting
- Custom report builder for billing analysis
- Trend visualization across billing cycles
- Anomaly detection highlights
- Payment performance analytics by consumer segment
- Status Tracking
- Real-time updates on bill delivery and payment
- Automated flagging of problematic bills
- Historical status change tracking
- Integration with collection processes for overdue bills
- Integration Points
- Direct links to customer profiles
- Connection to payment processing system
- Access to consumption data for validation
- Integration with bill template management
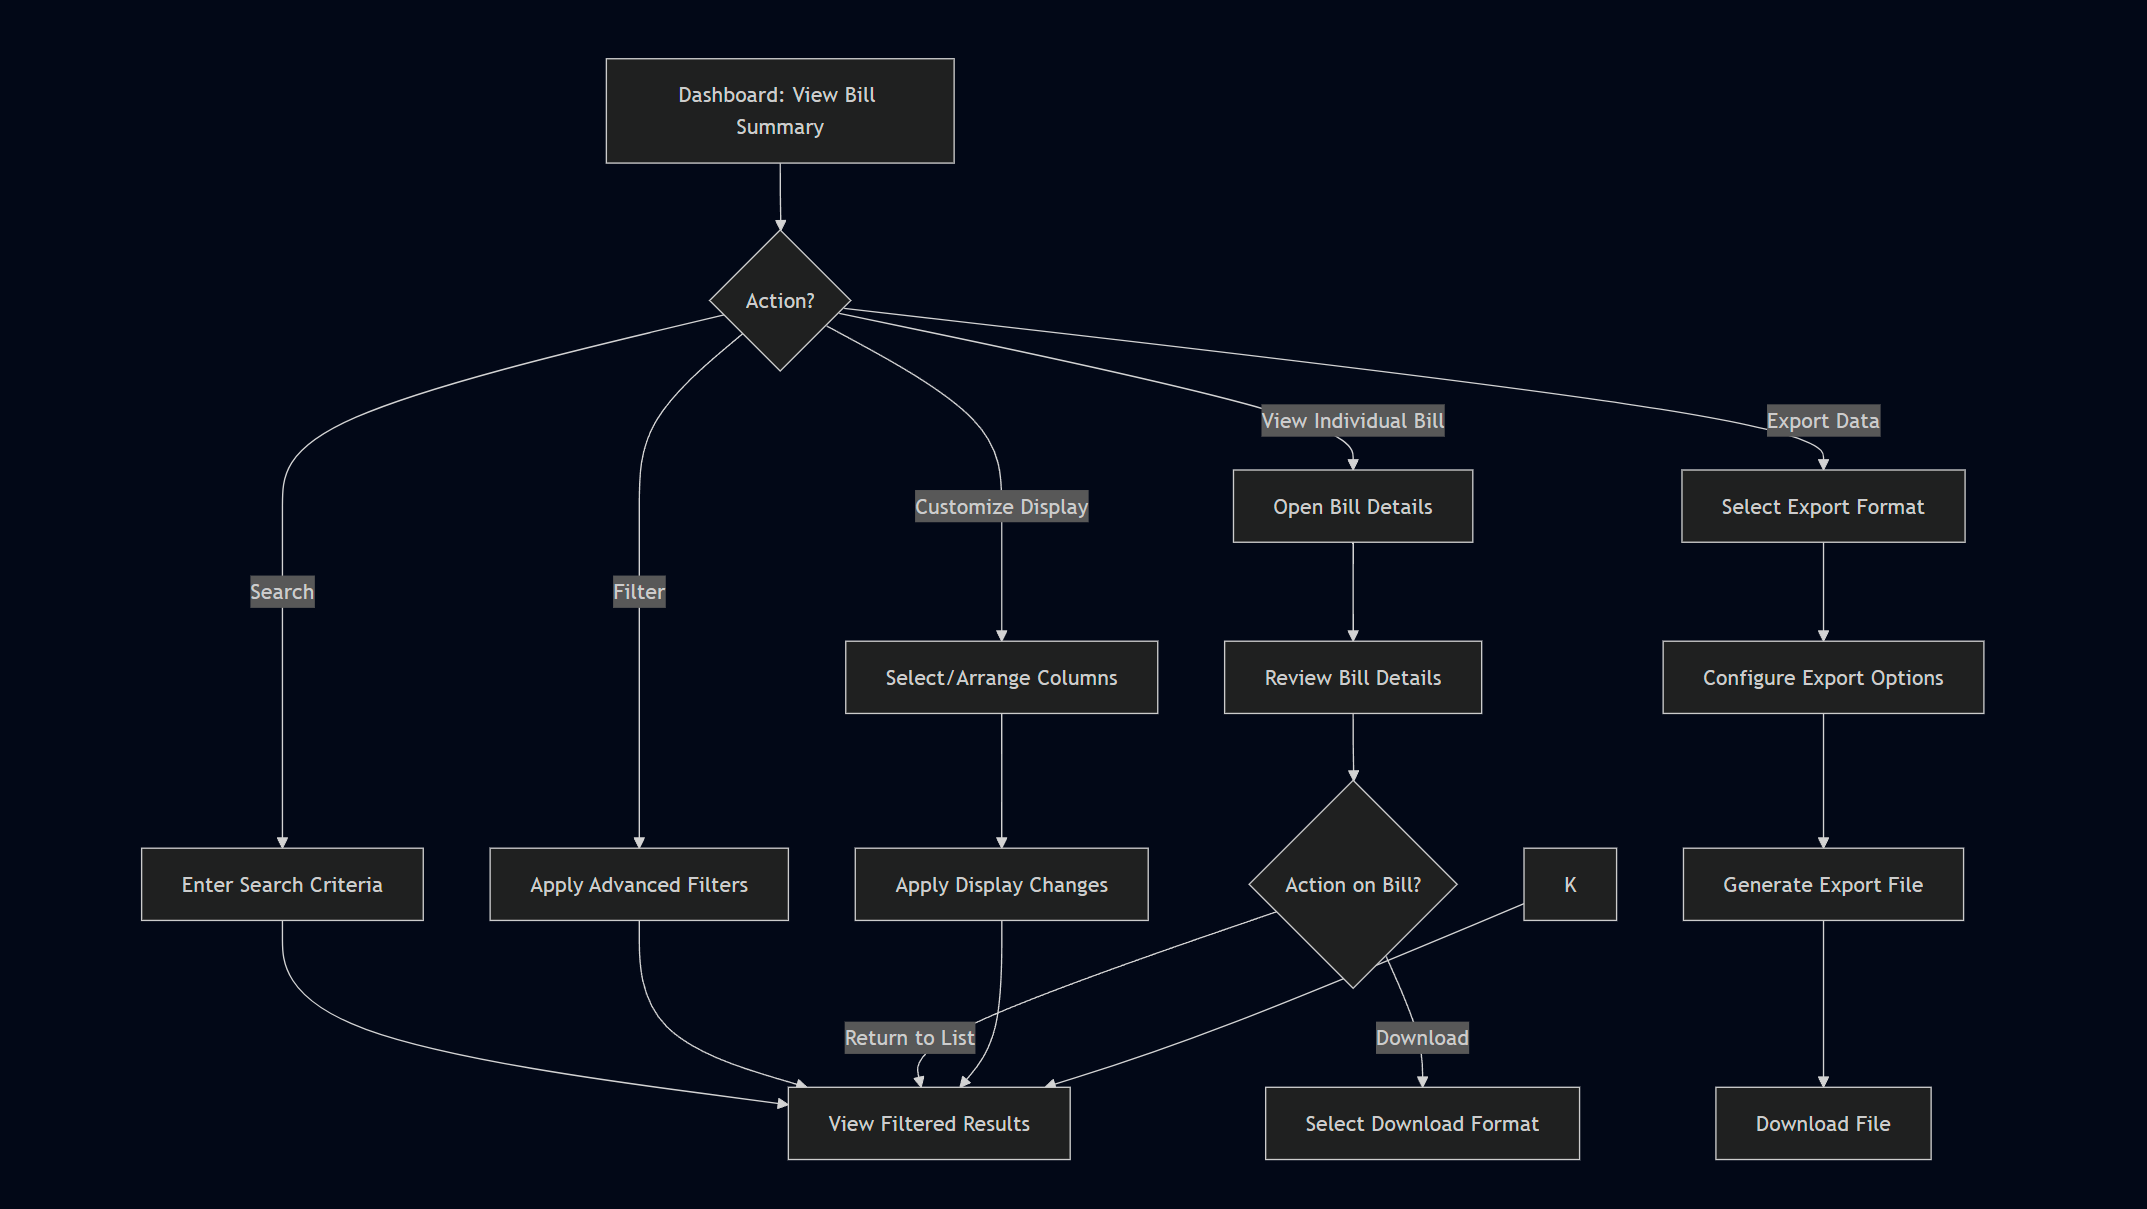
5. Major Steps Involved
For Billing Manager using the Master Bill Viewer feature:
- Access Master Bill Viewer
- Navigate to the Billing module in SMART360
- Select "Master Bill Viewer" from the navigation menu
- View initial dashboard with summary metrics cards
- See default view of recently generated bills
- Review Summary Metrics
- Examine Billing Summary cards (Total Bills, Consumption, Average Consumption, Actual/Non-Actual Bills)
- Review Financial Summary metrics (Billed Amount, Outstanding Amount, Consumption Charges, Service Charges, Late Fees)
- Note trend indicators showing percentage changes from previous period
- Identify any metrics requiring further investigation (e.g., significant increases or decreases)
- Search for Specific Bills
- Click in the search field at the top of the bill listing
- Enter search criteria (e.g., invoice number, customer name, account number)
- View filtered results displaying matching bills
- Refine search if necessary using additional keywords
- Apply Advanced Filters
- Click the "Filters" button to open the filters panel
- Select filter criteria from available options:
- Date range (bill generation date, due date)
- Consumer type (Residential, Commercial, Industrial)
- Premise type
- Bill cycle (Monthly, Bi-monthly, Quarterly)
- Billing month
- Consumption range
- Amount range
- Status (Delivered, Paid, Partially Paid, Overdue)
- Apply selected filters to narrow down bill listing
- Save frequently used filter combinations as presets
- Customize Column Display
- Click the "Columns" button to open column selection menu
- Check/uncheck columns to show/hide in the listing
- Reorder columns by drag and drop
- Apply changes to update the bill listing view
- Sort and Navigate Bills
- Click on column headers to sort bills by that attribute
- Use pagination controls to move between pages of results
- Adjust number of bills displayed per page
- Use quick navigation to jump to specific pages
- View Individual Bill Details
- Click the "View" icon in the Actions column for a specific bill
- Review complete bill information in a modal or detailed view
- Verify line items, charges, and calculations
- Check status history and delivery information
- Download Bills
- Click the "Download" icon in the Actions column for a specific bill
- Select preferred download format (PDF, CSV)
- Wait for download to complete
- Open downloaded file to view bill in selected format
- Perform Batch Operations
- Select multiple bills using checkboxes in the listing
- Choose batch action from available options:
- Export selected bills
- Update status for selected bills
- Generate report based on selection
- Confirm action in prompt dialog
- Receive notification upon completion
- Export Data for Analysis
- Click the "Export" button at the top of the bill listing
- Select export format (CSV, Excel, PDF)
- Choose whether to export all bills or only filtered results
- Specify which columns to include in export
- Confirm export to generate and download file
- Monitor Status Changes
- Review status column in bill listing to identify bills requiring attention
- Note visual indicators for different statuses (delivered, paid, partially paid, overdue)
- Track status change patterns over time
- Follow up on overdue or problematic bills as needed
6. Flow Diagram
7. Business Rules
Master Bill Viewer - Fields and Business Rules
Page Header Section
- Page Title
- Field Type: Text heading
- Data Source: System-defined
- Business Rules:
- Clearly identifies the purpose of the screen ("Master Bill Viewer")
- Consistent styling with application UI standards
- Provides context for all displayed information
- Page Description
- Field Type: Descriptive text
- Data Source: System-defined
- Business Rules:
- Concisely explains the page purpose: "Monitor, search, and manage all utility bills in one place"
- Provides user guidance on page functionality
- Consistent styling with lighter/secondary text
Billing Summary Section Changes based on the filtered criteria
- Section Heading: Billing Summary
- Field Type: Section title
- Data Source: System-defined
- Business Rules:
- Visually distinguishes the summary metrics section
- Groups related billing volume metrics
- Consistent styling with other section headings
- Total Bills
- Field Type: Metric card with trend indicator
- Data Source: Calculated from billing records
- Business Rules:
- Shows total count of bills in the system for the current period
- Includes trend comparison with previous month
- Format: Numeric value with percentage change
- Formula: Count of all bills in current period
- Trend indicator uses color coding (green for positive trend)
- Line chart icon provides visual context
- Consumption
- Field Type: Metric card with trend indicator
- Data Source: Calculated from billing records
- Business Rules:
- Shows total consumption across all bills in kWh
- Includes trend comparison with previous month
- Format: Numeric value with unit (kWh) and percentage change
- Formula: Sum of consumption values across all bills
- Trend indicator uses color coding (red for negative trend)
- Document icon provides visual context
- Average Consumption
- Field Type: Metric card with trend indicator
- Data Source: Calculated field
- Business Rules:
- Shows average daily consumption in kWh/day
- Includes trend comparison with previous month
- Format: Numeric value with unit (kWh/day) and percentage change
- Formula: Total Consumption ÷ (Number of days in period)
- Trend indicator uses color coding (green for positive trend)
- Envelope/email icon provides visual context
- Actual Bills
- Field Type: Metric card with trend indicator
- Data Source: Calculated from billing records
- Business Rules:
- Shows count of bills based on actual readings
- Includes trend comparison with previous month
- Format: Numeric value with percentage change
- Formula: Count of bills with reading type = "Actual"
- Trend indicator uses color coding (green for positive trend)
- Checkmark/document icon provides visual context
- Non-Actual Bills
- Field Type: Metric card with trend indicator
- Data Source: Calculated from billing records
- Business Rules:
- Shows count of bills based on estimated or other non-actual readings
- Includes trend comparison with previous month
- Format: Numeric value with percentage change
- Formula: Count of bills with reading type ≠ "Actual"
- Trend indicator uses color coding (green for negative trend - fewer non-actual bills is better)
- Document icon provides visual context
Financial Summary Section
- Section Heading: Financial Summary
- Field Type: Section title
- Data Source: System-defined
- Business Rules:
- Visually distinguishes the financial metrics section
- Groups related monetary metrics
- Consistent styling with other section headings
- Billed Amount
- Field Type: Currency metric card with trend indicator
- Data Source: Calculated from billing records
- Business Rules:
- Shows total monetary value of all bills in current period
- Includes trend comparison with previous month
- Format: Currency value ($) with decimal precision and percentage change
- Formula: Sum of all bill amounts in current period
- Trend indicator uses color coding (green for positive trend)
- Dollar sign icon provides visual context
- Outstanding Amount
- Field Type: Currency metric card with trend indicator
- Data Source: Calculated from accounts receivable
- Business Rules:
- Shows total unpaid amount across all bills
- Includes trend comparison with previous month
- Format: Currency value ($) with decimal precision and percentage change
- Formula: Sum of unpaid bill amounts
- Trend indicator uses color coding (green for negative trend - less outstanding is better)
- Dollar sign icon in red circle provides visual context for outstanding balances
- Consumption Charges
- Field Type: Currency metric card with trend indicator
- Data Source: Calculated from billing components
- Business Rules:
- Shows total charges specifically for consumption across all bills
- Includes trend comparison with previous month
- Format: Currency value ($) with decimal precision and percentage change
- Formula: Sum of consumption charge components across all bills
- Trend indicator uses color coding (green for positive trend)
- Credit card icon provides visual context
- Service Charges
- Field Type: Currency metric card with trend indicator
- Data Source: Calculated from billing components
- Business Rules:
- Shows total service charges across all bills
- Includes trend comparison with previous month
- Format: Currency value ($) with decimal precision and percentage change
- Formula: Sum of service charge components across all bills
- Trend indicator uses color coding (green for positive trend)
- Credit card icon provides visual context
- Late Fees
- Field Type: Currency metric card with trend indicator
- Data Source: Calculated from billing components
- Business Rules:
- Shows total late payment fees across all bills
- Includes trend comparison with previous month
- Format: Currency value ($) with decimal precision and percentage change
- Formula: Sum of late fee components across all bills
- Trend indicator uses color coding (green for negative trend - fewer late fees is better)
- Credit card icon with clock symbol provides visual context
Bill List Controls
- Search Field
- Field Type: Text input
- Data Source: User input
- Business Rules:
- Placeholder text: "Search bills..."
- Filters the bill list based on input
- Performs search across multiple columns (Invoice Number, Consumer, etc.)
- Dynamically updates results as user types
- Case-insensitive matching for better user experience
- Filters Button
- Field Type: Action button with icon
- Data Source: System functionality
- Business Rules:
- Opens advanced filtering options
- Icon: Funnel/filter symbol
- Allows filtering by multiple criteria simultaneously
- Filters would likely include date ranges, status, bill type, etc.
- Columns Button
- Field Type: Action button with icon
- Data Source: System functionality
- Business Rules:
- Opens column visibility controls
- Icon: Column/table layout symbol
- Allows customizing which columns are displayed
- Supports saving column preferences for future sessions
- Export Button
- Field Type: Action button with icon
- Data Source: System functionality
- Business Rules:
- Initiates export workflow for bill data
- Icon: Download symbol
- Likely supports multiple export formats (CSV, Excel, PDF)
- May offer options to export all bills or only filtered/selected bills
Bill List Table
- Table Header Row
- Field Type: Column headers with sort indicators
- Data Source: System-defined
- Business Rules:
- Defines columns for the bill list
- Sort indicators (▲/▼) show current sort direction
- Headers with sorting capability indicated by "⋮" symbol
- Consistent styling for visual organization
- Invoice Number Column
- Field Type: Text identifier column with sorting
- Data Source: Billing system
- Business Rules:
- Format: Standardized prefix "INV-" followed by numeric sequence
- Primary identifier for each bill
- Must be unique across the system
- Sortable in ascending/descending order
- Likely links to detailed bill view when clicked
- Consumer Column
- Field Type: Text with identifier
- Data Source: Customer database
- Business Rules:
- Shows consumer name and account number
- Format: Name with account number in smaller text below
- Account number format: "ACC-" followed by numeric sequence
- Sortable by consumer name
- Likely links to consumer profile when clicked
- Premise Column
- Field Type: Text category
- Data Source: Location database
- Business Rules:
- Shows premise type (Commercial, Industrial, etc.)
- Categorizes the service location
- Used for reporting and analysis
- Sortable alphabetically
- Bill Cycle Column
- Field Type: Text category
- Data Source: Billing configuration
- Business Rules:
- Shows billing frequency (Monthly, Quarterly)
- Determines how often bills are generated
- Affects due dates and payment terms
- Sortable alphabetically
- Billing Month Column
- Field Type: Text period
- Data Source: Billing period
- Business Rules:
- Shows month of the billing period
- Format: Month name (April, September)
- Used for monthly reporting and tracking
- Sortable chronologically (not strictly alphabetically)
- Consumption (Units) Column
- Field Type: Numeric with unit
- Data Source: Meter readings
- Business Rules:
- Shows consumption amount with unit (kWh)
- Calculated from meter reading difference
- Sortable numerically
- Important for consumption analysis and billing verification
- Billed Amount Column
- Field Type: Currency
- Data Source: Bill calculation
- Business Rules:
- Shows total bill amount with currency symbol ($)
- Format: Currency with decimal precision
- Sum of all charges (consumption, service, etc.)
- Sortable numerically
- Key financial metric for billing analysis
- Generated Date Column
- Field Type: Date
- Data Source: System timestamp
- Business Rules:
- Shows when bill was generated
- Format: YYYY-MM-DD
- Useful for tracking billing timeline
- Sortable chronologically
- May be important for due date calculations
- Status Column
- Field Type: Status indicator
- Data Source: Bill status tracking
- Business Rules:
- Shows current status with color-coded badge
- Statuses shown: "Delivered" (blue), "Partially Paid" (orange)
- Other possible statuses might include: Pending, Paid, Overdue
- Sortable by status priority
- Visually distinguishes bills requiring attention
- Actions Column
- Field Type: Icon buttons
- Data Source: System functions
- Business Rules:
- Provides row-level actions for each bill
- Icons shown: View (eye), Download (arrow)
- Other possible actions might include: Print, Email, Void
- Not sortable (control column)
- Provides quick access to common bill operations
Table Features and Controls
Bill Search Functionality
- The bill list should be searchable by:
- Invoice Number
- Consumer name or account number
- Premise type
- Billing period
- Amount range
- Status
Bill Sorting Functionality
- The bill list should be sortable by all columns, specifically:
- Invoice Number (ascending/descending)
- Consumer (alphabetical)
- Premise (alphabetical)
- Bill Cycle (alphabetical)
- Billing Month (chronological)
- Consumption (numeric high/low)
- Billed Amount (numeric high/low)
- Generated Date (newest/oldest)
- Status (priority order)
Bill Filtering Functionality
- The bill list should support filtering by:
- Date range (generation date, due date)
- Status (Delivered, Partially Paid, etc.)
- Bill Cycle (Monthly, Quarterly)
- Consumer type or group
- Premise type
- Consumption range
- Amount range
- Payment status
Bill Export Functionality
- The bill list should support exporting in multiple formats:
- CSV (for data analysis)
- Excel (for detailed analysis and reporting)
- PDF (for formal reporting)
- Export options should include:
- All bills or filtered subset
- Selected columns or all columns
- Include/exclude summary statistics
Overall System Business Rules
- Bill Aggregation Rules
- System aggregates bills across all utility types
- Metrics are calculated for the current period (likely monthly)
- Trend comparisons are made against previous period
- Positive trends are indicated by green text/arrows
- Negative trends are indicated by red text/arrows
- Context determines whether increasing or decreasing is positive
- Bill Classification Rules
- Bills are classified as "Actual" when based on actual meter readings
- "Non-Actual" bills include estimated readings or other calculation methods
- Higher percentage of actual bills is generally preferred
- Bills are tracked by standardized invoice numbers
- Bills have defined status progression (generation → delivery → payment)
- Financial Tracking Rules
- Financial metrics break down bill components:
- Consumption charges (based on usage)
- Service charges (fixed fees)
- Late fees (penalties for late payment)
- Outstanding amount tracks unpaid balances
- All financial metrics use consistent currency formatting
- Financial metrics are monitored for trend analysis
- Financial metrics break down bill components:
- Consumption Tracking Rules
- Consumption is tracked in appropriate units (kWh for electricity)
- Average consumption provides daily usage perspective
- Consumption trends may vary seasonally
- Consumption is a key driver of billing amounts
- Consumption patterns influence billing strategies
- Bill Status Rules
- Bills progress through defined statuses:
- Generated → Delivered → Partially Paid → Paid
- Or Generated → Delivered → Overdue → Collection
- Status is visually indicated by color-coded badges
- Status determines available actions and follow-up requirements
- Status transitions may trigger notifications or workflows
- Bills progress through defined statuses:
- User Interface Rules
- Dashboard provides high-level metrics for quick analysis
- Table provides detailed bill listing for management
- Search, filter, column customization, and export tools support various workflows
- Consistent visual indicators for status and trends
- Action buttons provide quick access to common operations
- Bill Cycle Rules
- Bills can be generated on different cycles (Monthly, Quarterly)
- Cycle affects due dates and payment terms
- Different cycles may have different templates or calculation methods
- Cycle information is important for financial forecasting and reporting
- Data Visualization Rules
- Metric cards use consistent layout and formatting
- Trend indicators use color and direction consistently
- Icons provide visual cues for metric types
- Status indicators use color coding for quick recognition
- Table layout provides efficient information scanning
8. Sample Data
Dashboard Summary Metrics:
- Total Bills: 2,458 (+12% vs last month)
- Consumption: 245,032 kWh (-8% vs last month)
- Average Consumption: 125 kWh/day (+5% vs last month)
- Actual Bills: 1,289 (+10% vs last month)
- Non-Actual Bills: 452 (-3% vs last month)
- Billed Amount: $542,032.58 (+8% vs last month)
- Outstanding Amount: $48,921.35 (-5% vs last month)
- Consumption Charges: $324,619.42 (+6% vs last month)
- Service Charges: $125,328.15 (+3% vs last month)
- Late Fees: $12,865.74 (-9% vs last month)
Bill Listing Sample:
- INV-10000
- Consumer: Consumer 1 (ACC-100000)
- Premise: Residential
- Bill Cycle: Bi-monthly
- Billing Month: November
- Consumption: 562 kWh
- Billed Amount: $56.67
- Generated Date: 2025-05-11
- Status: Delivered
- INV-10001
- Consumer: Consumer 2 (ACC-100001)
- Premise: Commercial
- Bill Cycle: Quarterly
- Billing Month: January
- Consumption: 794 kWh
- Billed Amount: $94.17
- Generated Date: 2025-05-05
- Status: Partially Paid
- INV-10002
- Consumer: Consumer 3 (ACC-100002)
- Premise: Residential
- Bill Cycle: Bi-monthly
- Billing Month: June
- Consumption: 759 kWh
- Billed Amount: $20.15
- Generated Date: 2025-04-26
- Status: Partially Paid
- INV-10003
- Consumer: Consumer 4 (ACC-100003)
- Premise: Commercial
- Bill Cycle: Quarterly
- Billing Month: November
- Consumption: 961 kWh
- Billed Amount: $4.19
- Generated Date: 2025-05-05
- Status: Paid
- INV-10004
- Consumer: Consumer 5 (ACC-100004)
- Premise: Industrial
- Bill Cycle: Monthly
- Billing Month: January
- Consumption: 746 kWh
- Billed Amount: $93.51
- Generated Date: 2025-04-27
- Status: Delivered
- INV-10005
- Consumer: Consumer 6 (ACC-100005)
- Premise: Residential
- Bill Cycle: Monthly
- Billing Month: September
- Consumption: 649 kWh
- Billed Amount: $75.07
- Generated Date: 2025-05-03
- Status: Paid
- INV-10006
- Consumer: Consumer 7 (ACC-100006)
- Premise: Commercial
- Bill Cycle: Bi-monthly
- Billing Month: December
- Consumption: 599 kWh
- Billed Amount: $35.49
- Generated Date: 2025-04-29
- Status: Overdue
9. Acceptance Criteria
- The system must display a dashboard with accurate billing metrics including total bills, consumption, and financial summaries
- The system must show trend indicators comparing current metrics with previous period (month, cycle)
- The system must provide a search function that supports partial matching on key fields (invoice, account, customer name)
- The system must allow filtering by multiple criteria including date range, consumer type, bill cycle, status, and amount range
- The system must enable saving and managing of frequently used filter combinations
- The system must display a paginated list of bills with sortable columns and customizable column selection
- The system must visually distinguish different bill statuses using color coding and clear indicators
- The system must provide quick-action buttons for common operations on individual bills
- The system must allow viewing detailed information for individual bills without leaving the interface
- The system must support downloading individual bills in PDF and CSV formats
- The system must enable selecting multiple bills for batch operations
- The system must provide export functionality for filtered bill sets in multiple formats
- The system must update bill status changes in near real-time from integrated systems
- The system must maintain a full audit trail of bill status changes
- The system must support at least 7 years of historical bill data access
- The system must load initial dashboard and bill listing in under 3 seconds
- The system must display clear error messages with suggested actions when operations fail
- The system must provide responsive performance when filtering large bill volumes (100,000+ records)
- The system must enforce appropriate security permissions for accessing sensitive billing data
- The system must log all export operations containing customer data for compliance purposes
10. Process Changes
| Current Process | New Process | Impact |
|---|---|---|
Manual searching across multiple systems/screens to locate bills | Centralized search with multiple criteria in a single interface | 85% reduction in time spent locating bills; no context switching between systems |
Limited visibility into billing metrics; requires custom reports | Real-time dashboard with key metrics and trend indicators | 60% improvement in anomaly detection and data-driven decision making |
Separate access for bill details, history, and status | Unified view with comprehensive bill info and status tracking | 70% reduction in time spent gathering info for customer inquiries |
Manual tracking of billing issues and follow-ups | Automated flagging of problematic bills with visual indicators | 50% improvement in issue resolution time; more proactive problem management |
Individual bill downloads requiring navigation to customer account | Direct download from centralized bill listing | 80% reduction in steps to get bill copies for verification or sharing |
Ad-hoc analysis needing manual exports and processing | Built-in filtering and export capabilities for targeted analysis | Enhanced ability to identify billing trends and patterns across customer segments |
Reliance on IT/support for complex bill searches | Self-service advanced filtering and saved search templates | 90% reduction in support requests related to bill locating; greater billing manager autonomy |
Manual status monitoring across billing cycles | Real-time consolidated status tracking | Improved visibility into payment patterns and collection opportunities |
11. Impact from Solving This Problem
| Metric | Improvement Impact |
|---|---|
Time to Locate Specific Bills | Reduced from 3-5 minutes to under 30 seconds (85% reduction) |
Customer Inquiry Resolution Time | Decreased from 24+ hours to 4-8 hours (70% reduction) |
Billing Issue Identification | Improved by 60% via pattern recognition and anomaly detection |
Audit Preparation Time | Reduced by 75% through streamlined data access and export |
Billing Manager Productivity | Increased by 30% through elimination of manual searches and reports |
Regulatory Compliance | Enhanced with complete audit trails and comprehensive record access |
Data-Driven Decision Making | Improved by 50% via real-time metrics and trend visualization |
Internal Process Efficiency | Enhanced by 40% through reduced dependence on support teams |
Customer Satisfaction | Increased by 25% through faster resolution of billing inquiries |
Revenue Collection | Improved by 15% through better payment visibility and trend tracking |
12. User Behavior Tracking
| Event | Properties | Metrics | Insights Provided |
|---|---|---|---|
Dashboard_View | user_id, time_spent, summary_expanded | Views per day, Avg. time on dashboard, Most viewed metrics | How billing managers engage with summary data; which metrics drive their attention |
Bill_Search | search_term, results_count, filters_applied | Search frequency, Search efficiency, Common search terms | Which bills or queries are most frequent; how effective are search strategies |
Filter_Apply | filter_types, filter_values, results_count | Filter combinations, Zero result filters, Filter efficiency | Which filter combos narrow searches best; identify ineffective filters |
Bill_View | bill_id, time_spent, sections_expanded | Views per bill, Time spent reviewing, Most examined details | Which bill sections demand most attention; user review patterns |
Bill_Download | bill_id, format_type, user_id | Download frequency, Format preferences, Download patterns | Why and how bills are downloaded; preferred formats |
Batch_Operation | operation_type, bills_count, completion_status | Operation frequency, Avg. batch size, Success rate | Efficiency and reliability of bulk operations |
Data_Export | filter_criteria, record_count, format_type | Export volume, Timing patterns, Export size | Patterns in data export indicating reporting needs |
Column_Customize | visible_columns, column_order, user_id | Customization frequency, Most valuable columns, Preferences | Which bill attributes users prioritize; customization trends |
Status_Change | bill_id, old_status, new_status, change_reason | Status transition frequency, Timeline, Manual vs. auto | Bill lifecycle progression; bottlenecks or manual intervention points |
Sort_Change | sort_column, sort_direction, user_id | Sort preferences, Popular columns, Sorting patterns | How users organize bill data to extract insights |
Preset_Save | preset_name, filter_criteria, user_id | Preset creation frequency, Usage, Common presets | Reusable search templates; workflow efficiency |
Error_Encounter | error_type, action_attempted, error_message | Error frequency, Common error types, Resolution time | UX friction points; system stability; common user errors |
Questions answered by tracking:
- Which bills require the most follow-up or investigation based on viewing patterns?
- What patterns in bill searching indicate potential process improvements?
- How do billing managers prioritize their work based on dashboard metrics?
- What correlations exist between bill attributes and payment performance?
- Which customer segments generate the most billing inquiries requiring investigation?
- How do seasonal patterns affect billing workload and issue resolution?
- What search and filter combinations most effectively identify potential billing errors?
- How quickly are billing issues identified and resolved after bill generation?
Wireframe
Wireframe: Link
No Comments