Billing manager dashboard(BX02US01)
Billing Dashboard User Story
1. Problem Statement
For Billing Manager
- Lacks a consolidated view of all billing data across cycles, zones, and time periods
- Has difficulty tracking billing exceptions and failures requiring attention
- Cannot easily monitor financial metrics and consumption patterns in one place
- Struggles to track performance trends across billing cycles
- Lacks quick access to action items for addressing billing issues
For Utility Administrator
- Cannot easily monitor overall billing performance and revenue metrics
- Lacks visibility into system-wide billing success rates and failures
- Has no central place to track consumption patterns across service areas
- Struggles to get insights into outstanding amounts and late payments
Core Problem
The billing operations team lacks a centralized, data-rich dashboard that provides real-time insights into billing performance, financial metrics, consumption patterns, and exceptions. This forces users to navigate between multiple screens and reports to gather necessary information, leading to inefficiency, delayed issue resolution, and potential revenue loss.
2. Who Are the Users Facing the Problem?
Billing Manager
Responsible for overseeing the entire billing cycle from meter data import to bill delivery, ensuring accurate implementation of rate structures and billing rules, managing exceptions/adjustments, and reporting on revenue performance.
Billing Specialist
Executes billing cycles according to established schedules, processes/resolves billing exceptions and errors, implements rate changes, and analyzes consumption data for billing anomalies.
Utility Administrator
Configures system settings to align with utility business processes, creates and maintains user roles, and develops custom reports and dashboards for executive leadership.
All three roles need access to the Billing Dashboard with appropriate permissions.
3. Jobs To Be Done
For Billing Manager:
When I need to monitor the overall health of billing operations across all zones, But I have to navigate through multiple screens and reports to gather this information, Help me access a comprehensive dashboard that consolidates all key billing metrics in one view, So that I can quickly identify issues, track performance, and make informed decisions.
For Billing Manager:
When I need to identify and resolve billing exceptions, But I lack visibility into which accounts failed to generate bills and why, Help me access a clear summary of exceptions with actionable details, So that I can prioritize and resolve issues before they impact revenue collection.
For Billing Specialist:
When I need to track the performance of specific billing cycles, But I cannot easily compare metrics across cycles or zones, Help me access detailed cycle-specific data with comparative analytics, So that I can ensure billing accuracy and completeness for each cycle.
For Billing Specialist:
When I need to analyze consumption patterns across customer segments, But I struggle to identify unusual trends or potential meter issues, Help me access consumption distribution metrics with clear visual indicators, So that I can detect anomalies and ensure accurate billing.
For Utility Administrator:
When I need to report on revenue performance to executive leadership, But I lack easy access to comprehensive financial summaries, Help me view consolidated financial metrics with trend analysis, So that I can provide accurate insights on billing performance and outstanding amounts.
4. Solution
Comprehensive Billing Dashboard
A centralized dashboard providing real-time visibility into billing operations with multiple views and drill-down capabilities.
Key Capability Areas:
- Dashboard Overview
- Monthly performance summary with key metrics (bills generated, success rate, revenue)
- Trend indicators showing changes from previous cycles
- Alert indicators for metrics requiring attention
- Quick-access navigation to detailed sections
- Billing Cycle Management
- Active billing cycles status display
- Cycle selection and filtering capabilities
- Detailed metrics for selected billing cycle
- Comparison with previous cycles' performance
- Bill Generation Analytics
- Total bills generated vs. failed generation
- Success rate tracking with historical comparison
- Breakdown of bill types (actual vs. estimated)
- Drill-down capabilities to view specific failed bills
- Consumption Analytics
- Total consumption overview across service areas
- Distribution of consumption categories (high, low, zero)
- Consumption trend analysis with previous period comparisons
- Anomaly highlighting for unusual consumption patterns
- Financial Tracking
- Total billed amount with trend indicators
- Service charges breakdown
- Outstanding amount tracking
- Late payment revenue monitoring
- Revenue trend visualization
- Quick Actions Panel
- One-click access to common billing operations
- Bulk bill generation capabilities
- Single bill generation for specific customers
- Print and distribution management
- GL code configuration
- Search and Filter
- Global search function for bills across all cycles
- Advanced filtering capabilities by multiple parameters
- Saved search functionality for common queries
- Batch processing of search results
- Export and Reporting
- One-click export of dashboard data
- Scheduled report generation
- Custom report creation
- Multiple format support (PDF, Excel, CSV)
- User Preferences
- Customizable dashboard layouts
- User-specific metric prioritization
- Notification and alert settings
- Saved views for quick access to common analyses
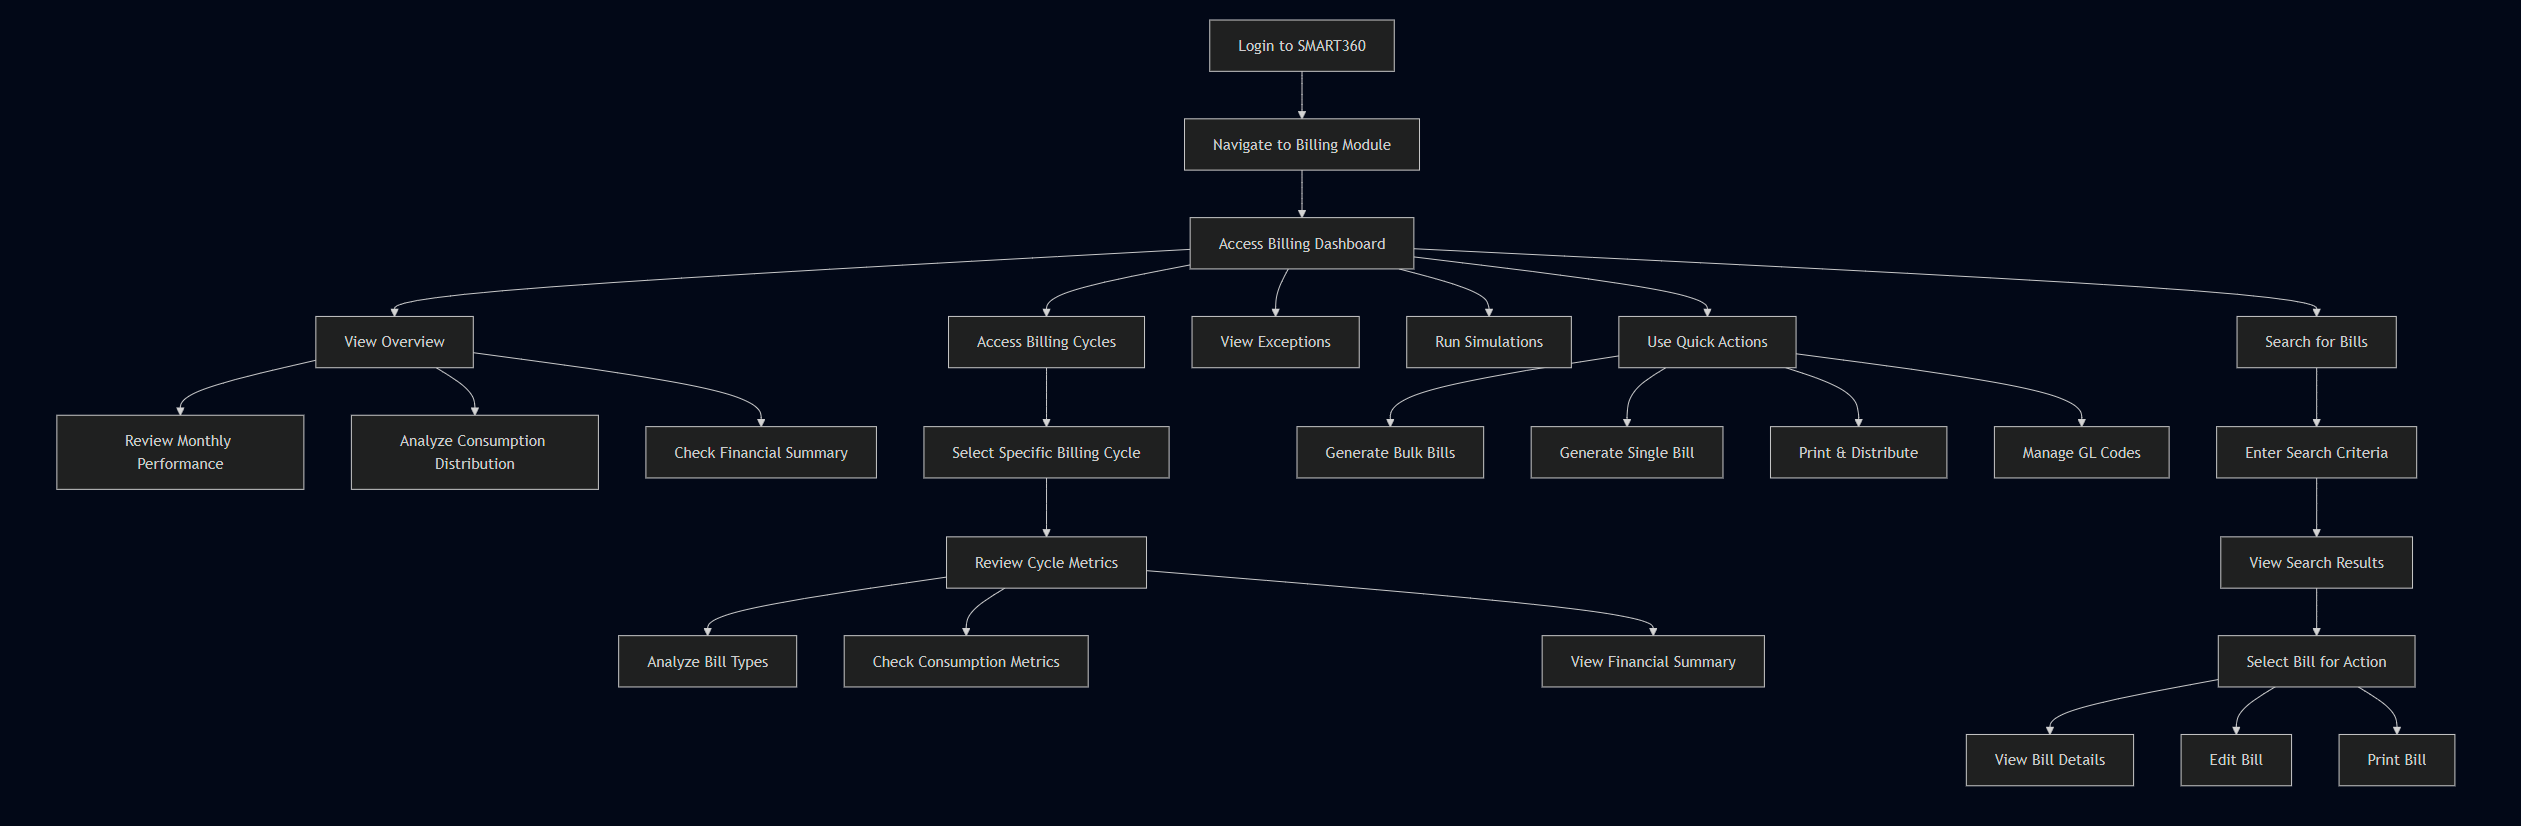
5. Major Steps Involved
For Billing Manager:
- Accessing the Dashboard
- Log into the SMART360 system
- Navigate to the Billing module
- Select "Billing Dashboard" from the main navigation menu
- View the consolidated overview screen with all key metrics
- Monitoring Billing Performance
- Review the "Monthly Performance" section showing total bills generated, bills not generated, success rate, and average bill amount
- Check trend indicators to compare with previous cycle and period
- Click on any metric card to access detailed information and drill-down views
- Analyzing Consumption Patterns
- Scroll to the "Consumption Distribution" section
- Review total consumption, high consumption accounts, low consumption accounts, and zero consumption accounts
- Note percentage changes from previous periods
- Click on any category to view a list of specific accounts for further investigation
- Reviewing Financial Metrics
- Navigate to the "Financial Summary" section
- Review total billed amount, service charges, outstanding amount, and late payment revenue
- Check trend indicators for each metric
- Click on outstanding amount to view aging analysis and account details
- Performing Quick Actions
- Access the "Quick Actions" panel
- Select desired action (Bulk Bill Generation, Single Bill Generation, Print & Distribute, GL Codes Management)
- Complete the action workflow from the panel without navigating away from the dashboard
For Billing Specialist:
- Analyzing Specific Billing Cycles
- Navigate to "Billing Cycles" tab
- Select desired cycle from the dropdown (e.g., "North Zone - May 2023")
- View cycle-specific metrics including total bills, bills not generated, success rate, and average bill amount
- Review breakdown of actual vs. estimated bills for the selected cycle
- Processing Exceptions
- Access exceptions for the current cycle
- Sort by priority or exception type
- Select exceptions to review details
- Process and resolve exceptions using the built-in workflow tools
- Mark exceptions as resolved or escalate as needed
- Generating Bills
- Use Quick Actions panel to access bill generation functions
- Select "Bulk Bill Generation" for creating multiple bills
- Follow the guided workflow to select parameters and customer segments
- Review results summary after generation is complete
- Handle any new exceptions that arise during generation
- Searching for Specific Bills
- Use the global search function at the top of the dashboard
- Enter search criteria (bill ID, consumer name, address)
- Review search results with key bill information
- Select bills for detailed view or batch operations
- Apply filters to narrow search results if needed
For Utility Administrator:
- Reviewing System Performance
- Access the Billing Dashboard with administrator view
- Review overall system metrics and success rates
- Identify any systemic issues affecting multiple billing cycles
- Generate executive reports from the dashboard data
- Configuring Dashboard Settings
- Access administrator controls for the dashboard
- Adjust metric thresholds for alerts and highlights
- Configure default views for different user roles
- Set up automated reporting schedules
- Analyzing Revenue Trends
- Review the "Revenue Trend" visualization
- Analyze patterns across multiple billing periods
- Identify potential areas for revenue optimization
- Generate reports for executive review
6. Flow Diagram
Billing Dashboard Navigation Flow
7. Business Rules
Billing Dashboard System - Field Analysis and Business Rules
Main Dashboard Overview
- Page Title and Description
- Field Type: Heading and descriptive text
- Data Source: System-defined
- Business Rules:
- Title clearly identifies the purpose of the screen ("Billing Dashboard")
- Description provides context: "Monitor billing cycles, review exceptions, and track revenue"
- Follows established UI pattern for page headers
- Monthly Performance Section
- Field Type: Section heading with icon
- Data Source: System-defined category
- Business Rules:
- Uses calendar icon to visually represent time period
- Groups relevant KPIs related to monthly billing performance
- Serves as container for performance metrics
- Billing Summary Subsection
- Field Type: Tab or subsection indicator
- Data Source: System-defined category
- Business Rules:
- Appears to be a selected tab or subsection within Monthly Performance
- Groups billing-specific metrics
- May support tab navigation to other related metrics
Billing Summary Cards
- Total Bills Generated
- Field Type: Metric card with trend indicators
- Data Source: Calculated from billing records
- Business Rules:
- Shows count of successfully generated bills in current period
- Includes comparison with previous periods
- Formula: Count of bills successfully generated in current cycle
- Visual indicators (arrows and colors) show trend direction
- Actual Bills
- Field Type: Metric card with trend indicators
- Data Source: Calculated from billing
- Business Rules:
- Shows count of bills generated from actual readings
- Includes comparison with previous periods
- Visual indicators show trend direction with context-appropriate colors (green for improvement)
- Non Actual Bills
- Field Type: Count of Non actual Bills
- Data Source: Calculated field
- Business Rules:
- Check icon provides visual context for success metric
- Includes comparison with previous periods
- Visual indicators show trend direction with context-appropriate colors (green for improvement)
- Average Bill Amount
- Field Type: Currency metric card
- Data Source: Calculated from billing records
- Business Rules:
- Formula: Sum of all bill amounts ÷ Total bills generated
- Currency symbol from ONB
- Includes comparison with previous periods
- Visual indicators show trend direction with context-appropriate colors (green for improvement)
Consumption Distribution Section
- Consumption Distribution Heading
- Field Type: Section heading with icon
- Data Source: System-defined category
- Business Rules:
- Uses energy/lightning bolt icon to represent consumption
- Groups metrics related to consumption patterns
- Serves as container for consumption metrics
- Total Consumption
- Field Type: Metric card with trend indicators
- Data Source: Calculated from meter readings
- Business Rules:
- Shows total consumption in kWh for current period
- Includes comparison with previous period
- Formula: Sum of all consumption values in current cycle
- Visual indicators show trend direction
- Energy icon provides visual context for metric type
- High Consumption
- Field Type: Metric card with trend indicators
- Data Source: Calculated from consumption outliers
- Business Rules:
- Shows count of consumers with high consumption
- Definition of "high" likely based on threshold settings
- Includes comparison with previous period
- Upward arrow icon indicates this represents higher-than-normal usage
- Visual indicators show trend (green indicates improvement or expected behavior)
- Low Consumption
- Field Type: Metric card with trend indicators
- Data Source: Calculated from consumption outliers
- Business Rules:
- Shows count of consumers with low consumption
- Definition of "low" likely based on threshold settings
- Includes comparison with previous period
- Downward arrow icon indicates this represents lower-than-normal usage
- Visual indicators show trend (green indicates improvement or expected behavior)
- Average Consumption
- Field Type: Metric card with trend indicators
- Data Source: Calculated from meter readings
- Business Rules:
- Shows count of consumers with no consumption recorded
- Formula: Total Consumption of all bills / Total number of consumers of that bills
- Includes comparison with previous period
- Visual indicators show trend (red indicates negative trend for zero consumption)
Financial Summary Section
- Financial Summary Heading
- Field Type: Section heading with icon
- Data Source: System-defined category
- Business Rules:
- Uses currency/money icon to represent financial data
- Groups metrics related to financial performance
- Serves as container for financial metrics
- Total Billed Amount
- Field Type: Currency metric card with trend indicators
- Data Source: Calculated from billing records
- Business Rules:
- Shows total monetary value of all bills generated
- Currency symbol (₹) indicates Indian Rupees
- Includes comparison with previous period
- Formula: Sum of all bill amounts in current cycle
- Visual indicators show trend direction
- Document icon provides visual context for billing metric
- Service Charges
- Field Type: Currency metric card with trend indicators
- Data Source: Calculated from billing components
- Business Rules:
- Shows total service charges applied across all bills
- Currency symbol (₹) indicates Indian Rupees
- Includes comparison with previous period
- Formula: Sum of all service charge components
- Visual indicators show trend direction
- Credit card icon provides visual context for service charge
- Outstanding Amount
- Field Type: Currency metric card with trend indicators
- Data Source: Calculated from accounts receivable
- Business Rules:
- Shows total unpaid amount across all bills
- Currency symbol (₹) indicates Indian Rupees
- Includes comparison with previous period
- Formula: Sum of all unpaid bill amounts
- Visual indicators show trend direction (red indicates negative trend)
- Document with check icon provides visual context for outstanding balances
- Late Payment Revenue
- Field Type: Currency metric card with count
- Data Source: Calculated from late payment fees
- Business Rules:
- Shows total revenue from late payment charges
- Currency symbol (₹) indicates Indian Rupees
- Shows count of payments with late fees (357 payments)
- Formula: Sum of all late payment fees collected
- Clock/time icon provides visual context for late payment
Active Billing Cycles Section (Image 2)
- Active Billing Cycles Heading
- Field Type: Section heading with icon
- Data Source: System-defined category
- Business Rules:
- Uses calendar icon to represent cycle periods
- Serves as container for active cycle information
- Cycle Search Bar
- Field Type: Dropdown selector
- Data Source: Available billing cycles
- Business Rules:
- Format: Cycle Name - Month
- Additional details shown: utility type and date range
- Currently selected: "North Zone - May 2023"
- Controls which cycle data is displayed in the section
- Allows switching between active billing cycles
- Cycle Title and Date Range
- Field Type: Text heading with date range
- Data Source: Selected cycle information
- Business Rules:
- Shows currently selected cycle name
- Date range shown in format: "May 1 - May 31, 2023"
- Provides clear context for the displayed metrics
Cycle Summary Cards
- Total Bills (Cycle)
- Field Type: Metric card with trend indicators
- Data Source: Calculated from cycle billing records
- Business Rules:
- Shows count of bills generated in selected cycle
- Includes comparison with previous cycle and period
- Formula: Count of bills in selected cycle
- Similar to dashboard metric but specific to selected cycle
- Actual Bills
- Field Type: Metric card with trend indicators
- Data Source: Calculated from cycle exceptions
- Business Rules:
- Shows count of bills that are actual
- Includes comparison with previous cycle and period
- Similar to dashboard metric but specific to selected cycle
- Estimated Bills
- Field Type: Numerical
- Data Source: Calculated field
- Business Rules:
- Represents non actual bill generation in selected cycle
- Similar to dashboard metric but specific to selected cycle
- Average Bill Amount (Cycle)
- Field Type: Currency metric card
- Data Source: Calculated from cycle billing records
- Business Rules:
- Formula: Sum of all bill amounts in cycle ÷ Total bills in cycle
- Currency symbol (₹) indicates Indian Rupees
- Similar to dashboard metric but specific to selected cycle
Consumption Metrics Section
- Consumption Metrics Heading
- Field Type: Section heading with icon
- Data Source: System-defined category
- Business Rules:
- Uses energy/lightning bolt icon similar to dashboard section
- Labels the consumption metrics for selected cycle
- High Consumption (Cycle)
- Field Type: Metric with comparison and trend
- Data Source: Calculated from cycle consumption data
- Business Rules:
- Shows count of high consumption accounts in selected cycle
- Shows previous count and percentage change
- Formula for percentage change: ((Current - Previous) ÷ Previous) × 100% > 50
- Color coding indicates trend direction (green for increase, as this appears expected)
- Low Consumption (Cycle)
- Field Type: Metric with comparison and trend
- Data Source: Calculated from cycle consumption data
- Business Rules:
- Shows count of low consumption accounts in selected cycle
- Shows previous count and percentage change
- Formula for percentage change: ((Current - Previous) ÷ Previous) × 100% < -50
- Color coding indicates trend direction
- Average Consumption
- Field Type: Metric card with trend indicators
- Data Source: Calculated from meter readings
- Business Rules:
- Shows count of consumers with no consumption recorded
- Formula: Total Consumption of all bills / Total number of consumers of that bills
- Includes comparison with previous period
- Visual indicators show trend (red indicates negative trend for zero consumption)
Financial Summary Section (Cycle)
- Financial Summary Heading (Cycle)
- Field Type: Section heading with icon
- Data Source: System-defined category
- Business Rules:
- Uses currency/money icon similar to dashboard section
- Labels the financial metrics for selected cycle
- Total Billed (Cycle)
- Field Type: Currency metric
- Data Source: Calculated from cycle billing records
- Business Rules:
- Shows total monetary value of all bills in selected cycle
- Currency symbol (₹) indicates Indian Rupees
- Formula: Sum of all bill amounts in selected cycle
- Service Charges (Cycle)
- Field Type: Currency metric
- Data Source: Calculated from cycle billing components
- Business Rules:
- Shows total service charges in selected cycle
- Currency symbol (₹) indicates Indian Rupees
- Formula: Sum of all service charge components in cycle
- Outstanding (Cycle)
- Field Type: Currency metric
- Data Source: Calculated from cycle accounts receivable
- Business Rules:
- Shows total unpaid amount for selected cycle
- Currency symbol (₹) indicates Indian Rupees
- Formula: Sum of all unpaid bill amounts in cycle
- Add Late fee also
Quick Actions Section
- Quick Actions Heading
- Field Type: Section heading
- Data Source: System-defined category
- Business Rules:
- Labels the quick actions section
- Groups common operations for easy access
- Bulk Bill Generation Card
- Field Type: Action card with button
- Data Source: System functionality
- Business Rules:
- Title: "Bulk Bill Generation"
- Description: "Generate bills for multiple consumers"
- Icon: Document with plus symbol
- Button: "Generate Bulk"
- Initiates workflow for generating multiple bills simultaneously
- Navigate user to bulk bill generation
- Single Bill Generation Card
- Field Type: Action card with button
- Data Source: System functionality
- Business Rules:
- Title: "Single Bill Generation"
- Description: "Generate bill for a single consumer"
- Icon: Document
- Button: "Generate Bill"
- Initiates workflow for generating a single bill
- Navigate user to single bill generation
- Print & Distribute Card
- Field Type: Action card with button
- Data Source: System functionality
- Business Rules:
- Title: "Print & Distribute"
- Description: "Manage printing and distribution"
- Icon: Printer
- Button: "Print Options"
- Initiates workflow for printing and distributing bills
- Navigate user to printing and distribution
- GL Codes Management Card
- Field Type: Action card with button
- Data Source: System functionality
- Business Rules:
- Title: "GL Codes Management"
- Description: "Configure and manage GL codes"
- Icon: Document with settings
- Button: "Manage Codes"
- Initiates workflow for managing General Ledger codes used in billing
- Navigate user to GL codes section in settings
8. Sample Data
Billing Summary Sample Data
| Metric | Current Value | Previous Cycle | % Change |
|---|---|---|---|
Total Bills Generated | 26,410 | 25,892 | +2% |
Bills Not Generated | 68 | 103 | -34% |
Success Rate | 98.2% | 96.4% | +1.8% |
Average Bill Amount | ₹1,168 | ₹1,142 | +2.3% |
Consumption Distribution Sample Data
| Metric | Current Value | Previous Cycle | % Change |
|---|---|---|---|
Total Consumption | 8,765,320 kWh | 8,530,420 kWh | +2.8% |
High Consumption Accounts | 1,187 | 1,120 | +6% |
Low Consumption Accounts | 711 | 665 | +6.9% |
Zero Consumption Accounts | 150 | 178 | -15.7% |
Financial Summary Sample Data
| Metric | Current Value | Previous Cycle | % Change |
|---|---|---|---|
Total Billed Amount | ₹12,650,000 | ₹12,250,000 | +3.3% |
Service Charges | ₹1,897,500 | ₹1,837,500 | +3.3% |
Outstanding Amount | ₹4,328,000 | ₹4,532,000 | -4.7% |
Late Payment Revenue | ₹285,600 | ₹265,300 | +7.7% |
Billing Cycle Specific Sample Data (North Zone - May 2023)
| Metric | Current Value | Previous Cycle | % Change |
|---|---|---|---|
Total Bills | 12,497 | 12,251 | +2% |
Bills Not Generated | 35 | 52 | -94% |
Success Rate | 99.98% | 99.58% | +0.4% |
Average Bill Amount | ₹1,215 | ₹1,195 | +1.7% |
Actual Bills | 11,500 (92.0%) | 11,200 (91.4%) | +2.7% |
Estimated Bills | 997 (8.0%) | 1,100 (8.6%) | -9.4% |
9. Acceptance Criteria
- The system must display a comprehensive overview dashboard with Monthly Performance, Consumption Distribution, and Financial Summary sections.
- The system must provide trend indicators for all metrics comparing current period with previous cycle and same period last year.
- The system must allow users to navigate between Overview, Billing Cycles, Exceptions, and Simulations tabs.
- The system must enable filtering of billing data by date range, service area, and customer segment.
- The system must display all financial metrics with proper currency formatting and thousand separators.
- The system must calculate and display billing success rates with at least two decimal places of precision.
- The system must provide drill-down capability from summary metrics to detailed account listings.
- The system must highlight metrics with significant changes (>5%) using color-coded indicators.
- The system must allow users to select specific billing cycles for detailed analysis.
- The system must display a breakdown of actual vs. estimated bills for each billing cycle.
- The system must categorize consumption into High, Low, and Zero segments with count and trend data.
- The system must provide a Quick Actions panel with access to Bulk Bill Generation, Single Bill Generation, Print & Distribute, and GL Codes Management.
- The system must include a global search function that allows searching by bill ID, consumer name, and address.
- The system must allow limiting search to current cycle or searching across all cycles.
- The system must generate exportable reports of all dashboard data in multiple formats.
- The system must refresh dashboard data automatically at configurable intervals.
- The system must maintain performance with data loads of up to 100,000 bills per cycle.
- The system must provide appropriate error handling and user notifications for data loading issues.
- The system must restrict dashboard access based on user roles and permissions.
- The system must maintain an audit log of all actions taken from the dashboard interface.
10. Process Changes
| Current Process | New Process | Impact |
|---|---|---|
Billing managers manually navigate between multiple screens to gather performance metrics | All key metrics available in a single, consolidated dashboard view | 60% reduction in time spent gathering data; more time for analysis and issue resolution |
Billing specialists manually identify and track exceptions through various reports | Categorized exceptions with priority indicators shown in a dedicated dashboard section | 40% faster exception identification and resolution; improved systemic issue tracking |
Financial metric analysis requires combining data from multiple sources | Financial metrics auto-calculated and displayed with trend analysis | 70% reduction in report preparation time; more accurate, timely financial insights |
Consumption pattern analysis requires complex manual calculations | Automatically categorized consumption patterns with trend indicators | 50% better anomaly detection; improved identification of meter issues |
Billing cycle performance tracked via custom reports | Real-time performance metrics with comparative analysis | 45% better visibility into cycle-specific performance; faster issue identification |
Bill generation accessed through a separate module | Quick Actions panel on dashboard allows direct access to bill generation | 30% reduction in initiation time; improved operational efficiency |
Bill search requires menu navigation | Global search function available directly from the dashboard | 55% faster access to bill info; better customer service response |
Trend analysis done by manually comparing historical data | Automated trend indicators with visual cues | 65% better trend identification; enables proactive issue management |
11. Impact from Solving This Problem
| Metric | Impact |
|---|---|
Operational Efficiency | 40-50% reduction in time spent gathering and analyzing billing data; streamlined workflows |
Revenue Collection | 15-20% improvement in timely identification and resolution of billing issues |
Exception Resolution Time | 30-35% reduction in time to identify, assign, and resolve billing exceptions |
Data-Driven Decision Making | 60% increase in availability of actionable insights for billing operations management |
Customer Satisfaction | 25% reduction in billing-related customer complaints due to improved accuracy and timeliness |
Staff Productivity | 45% reduction in manual reporting effort, enabling focus on value-added activities |
System Adoption | 30% increase in system usage by billing team members due to improved interface and functionality |
Compliance and Audit | 50% improvement in documenting and demonstrating regulatory compliance |
Financial Visibility | 70% increase in transparency of revenue metrics and outstanding amounts |
Management Confidence | Significant qualitative improvement in trust of billing data and performance metrics |
12. User Behavior Tracking
Billing Manager
| Metric | Events to Track | Properties | Insights Provided |
|---|---|---|---|
Dashboard Usage | Dashboard_View, Tab_Navigation, Metric_Drilldown | User ID, Time spent, Tabs viewed, Metrics clicked | Frequency and depth of manager engagement; key metrics of interest |
Exception Management | Exception_View, Exception_Action, Exception_Resolution | Exception type, Priority, Time to resolution, Action taken | Effectiveness of exception handling; common resolution patterns |
Financial Analysis | Financial_Metric_View, Revenue_Trend_Analysis | Metrics viewed, Time spent, Export actions | Usage patterns of financial data; metrics influencing decisions |
Quick Actions Usage | Quick_Action_Initiated, Quick_Action_Completed | Action type, Completion time, Error rate | Popularity of actions; workflow bottlenecks or friction points |
Questions Answered:
- How do billing managers prioritize their monitoring activities?
- Which exception types require the most management attention?
- Are financial trends being adequately analyzed before decisions?
- How effective is the Quick Actions functionality in streamlining operations?
Billing Specialist
| Metric | Events to Track | Properties | Insights Provided |
|---|---|---|---|
Cycle Analysis | Cycle_Selection, Cycle_Metric_View, Cycle_Comparison | Cycle ID, Metrics viewed, Comparison periods | How specialists analyze cycle performance; key metrics driving investigations |
Bill Generation | Bill_Generation_Started, Bill_Generation_Completed | Generation type (bulk/single), Volume, Success rate | Effectiveness of bill generation; identifying common failure points |
Consumption Analysis | Consumption_Category_View, Consumption_Account_Drilldown | Category type, Number of accounts, Actions taken | How specialists monitor consumption patterns; triggers for investigations |
Search Behavior | Search_Initiated, Search_Results_View, Search_Filter_Applied | Search terms, Filters used, Results count, Action taken | How specialists locate bills; common search patterns |
Questions Answered:
- Which billing cycles require the most specialist attention?
- How effective is the bill generation process?
- What consumption patterns trigger specialist investigation?
- How do specialists locate and manage specific customer accounts?
Utility Administrator
| Metric | Events to Track | Properties | Insights Provided |
|---|---|---|---|
System Performance | Dashboard_Load_Time, Data_Refresh, Error_Occurrence | Load duration, Data volume, Error type | Technical dashboard performance; identify optimization opportunities |
Report Generation | Report_Creation, Report_Export, Report_Scheduling | Report type, Format, Frequency, Distribution | How admins use reporting; patterns in report creation and sharing |
Configuration Actions | Settings_Modification, User_Permission_Change | Setting type, Permission changes, User affected | How admins manage system settings and user permissions |
Executive Metrics | Executive_View_Access, High_Level_Metric_View | Metrics viewed, Time spent, Export actions | Which metrics execs focus on; their reporting and data needs |
Questions Answered:
- Is the dashboard performing adequately under actual usage conditions?
- How are reports being utilized for management communication?
- What configuration changes occur most frequently?
- Which metrics are most valuable for executive reporting?
Wireframe
Wireframe: Link
No Comments