Smart Meter Reads (MX02US05)
1. Problem Statement
Meter Reading Supervisor Pain Points:
- Cannot efficiently track the status and progress of multiple read cycles across different routes
- Lacks visibility into performance metrics for individual routes and specific meters
- No clear options to retry failed reads or resolve issues promptly
- Has limited ability to identify and address common failure patterns in the reading process
- Cannot easily monitor the distribution of successful, failed, and pending readings
- Struggles to meet cycle completion deadlines due to limited tracking capabilities
Core Problem: The current meter reading management system lacks comprehensive tracking and performance monitoring capabilities for smart meter readings, resulting in inefficient reading collections, delayed cycle completions, and quality control issues across the utility service areas. Without proper visibility into cycle performance and route status, the Meter Reading Supervisor cannot effectively manage the meter reading operation, leading to billing delays and potential revenue loss.
2. Who Are the Users Facing the Problem?
Meter Reading Supervisor:
- Responsible for overseeing meter reading operations across multiple routes
- Manages reading schedules aligned with billing cycles
- Monitors reading performance and coordinates exception handling
- Reports on reading completion rates and efficiency metrics
- Ensures timely data collection for billing processing
The Meter Reading Cycles feature should be accessible to the Meter Reading Supervisor role and potentially to other management roles that need visibility into meter reading operations.
3. Jobs To Be Done
For Meter Reading Supervisor: When I need to monitor the progress of multiple meter reading cycles across different routes, But I lack a consolidated view of cycle statuses and completion rates, Help me track all active and completed cycles with detailed performance metrics, So that I can ensure timely completion of readings for billing cycles.
For Meter Reading Supervisor: When I need to identify and resolve failed meter readings, But I cannot easily see which meters have failed and why, Help me view categorized failure reasons with options to retry failed readings, So that I can improve reading success rates and address systematic issues.
For Meter Reading Supervisor: When I need to report on meter reading performance, But I don't have access to comprehensive metrics and visualizations, Help me access detailed analytics on read success rates, completion percentages, and average read times, So that I can identify opportunities for improvement and report accurately to management.
For Meter Reading Supervisor: When I need to investigate specific meter issues within a cycle, But I cannot easily search for and access individual meter data, Help me search and filter meter records with detailed status information, So that I can quickly address customer inquiries and technical issues.
4. Solution
The Meter Reading Cycles feature provides a comprehensive dashboard and management system for tracking, analyzing, and improving the performance of smart meter reading operations. The solution includes:
Cycle Monitoring Capabilities
- Cycle Overview Dashboard: Real-time dashboard showing active cycles, completion rates, and key performance indicators
- Cycle Status Tracking: Visual indicators of cycle status (In Progress, Completed) with progress percentages
- Cycle Timeline Management: Clear display of cycle dates including last run, next run, and due dates
Route Management
- Route Performance Visualization: Graphical representation of route completion status across different areas
- Route Comparison: Ability to compare performance metrics across different routes
- Geographical Distribution: Visualization of reading success rates by geographical area
Reading Status Tracking
- Status Distribution Analytics: Visual breakdown of reading statuses (Success, Failed, Pending)
- Failure Analysis: Categorization and quantification of failure reasons (Timeout, Connection Error, Device Offline)
- Trend Analysis: Historical performance data to identify patterns and improvements
Meter-Level Management
- Detailed Meter Records: Comprehensive view of individual meter statuses and reading data
- Failure Resolution Tools: Options to retry failed readings directly from the interface
- Consumption Validation: Display of current and previous readings with consumption calculation
Search and Filter
- Advanced Search Functionality: Ability to search cycles by name and meters by ID, consumer, or account
- Multi-criteria Filtering: Filter meters by status (Success, Failed, Pending)
- Export Capabilities: Export filtered data for reporting and analysis
Performance Analytics
- Reading Time Metrics: Average read time tracking across cycles and routes
- Completion Rate Monitoring: Percentage tracking of cycle completion
- Resource Optimization Insights: Data to inform scheduling and resource allocation decisions
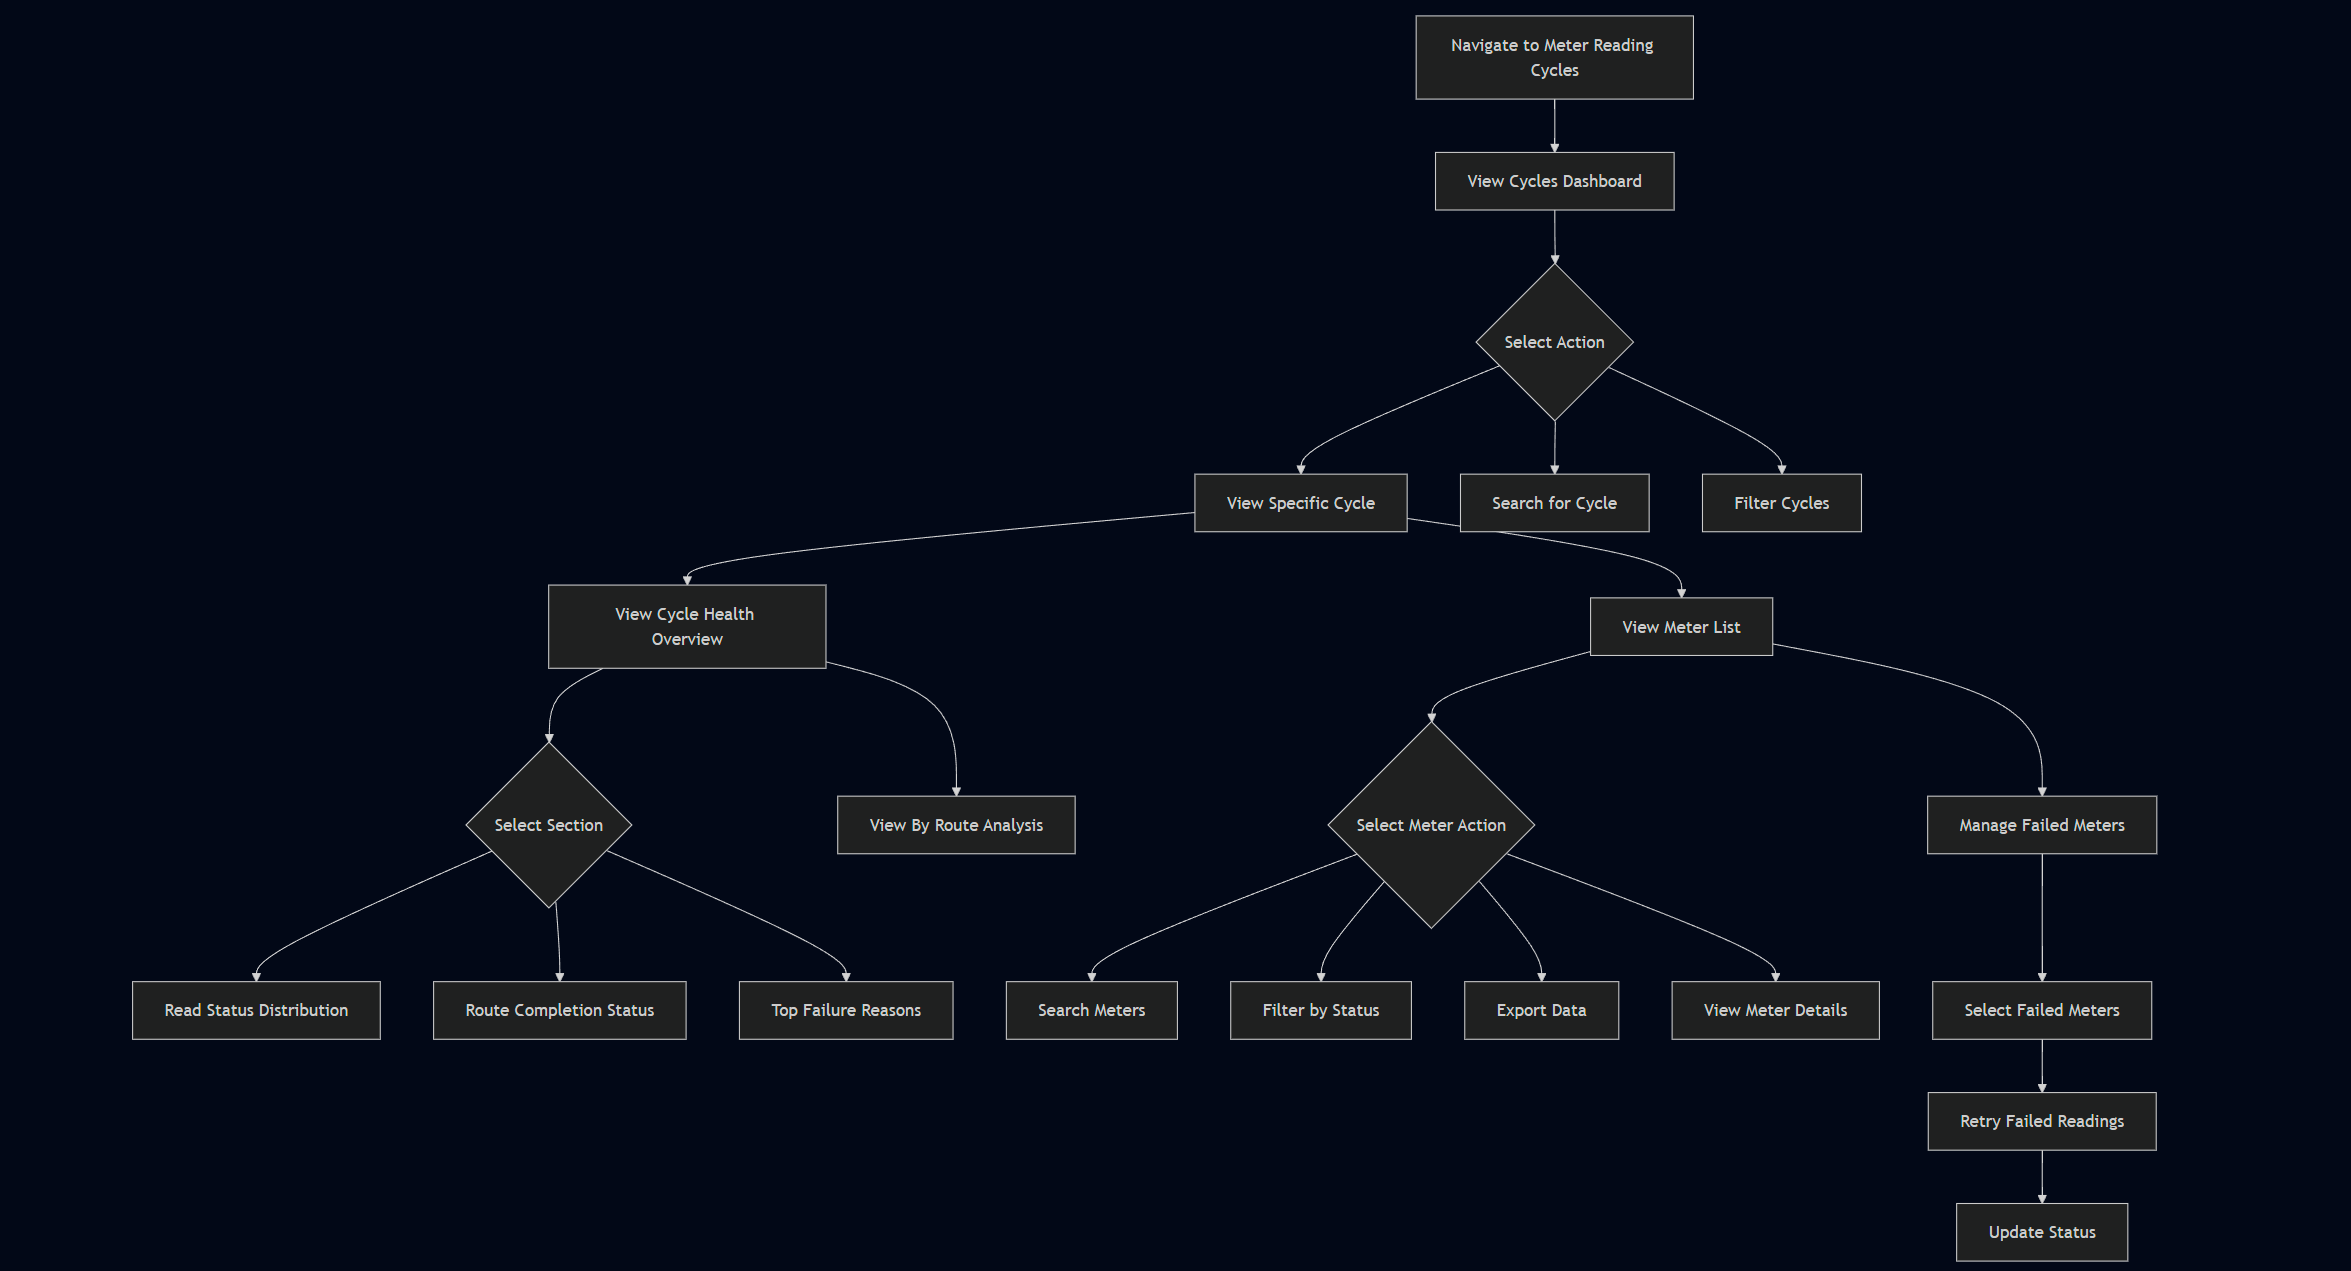
5. Major Steps Involved
Viewing Cycle Overview
Monitoring Cycle Progress
- Identify cycles that require attention based on status, completion percentage, and due dates
- Click "View" on a specific cycle to access detailed information
- Review the cycle health overview showing read status distribution and route completion status
- Analyze the top failure reasons to understand common issues
- Monitor the progress bar indicating how many reads have been completed out of total reads
Managing Failed Readings
- On the cycle detail page, click on the "Failed Reads" tab to see all failed meters
- Review the list of failed meters with details on failure reasons
- Select one or multiple failed meters
- Click "Retry Failed" to attempt to read the selected meters again
- Monitor the status change of retried meters
Investigating Individual Meters
- Use the search function to find a specific meter by ID, consumer, or account
- Apply status filters (All, Success, Failed, Pending) to narrow down results
- Click on a meter record to view full details
- Review the meter's reading history, current status, and consumption data
- Take appropriate action based on the meter's status (e.g., retry failed readings)
Analyzing Route Performance
Exporting Data for Reporting
- Apply desired filters to the meter list
- Click the "Export" button
- Select the export format and options
- Download the exported file
- Use the data for reporting or further analysis
6. Flow Diagram
7. Business Rules
Cycle Management Rules
- Each meter reading cycle must be associated with a specific route and month
- Cycles can have one of the following statuses: "In Progress" or "Completed"
- A cycle is considered "Completed" when 100% of its meters have been successfully read
- The completion rate is calculated as: (Number of successful reads / Total number of meters) * 100
- The average read time is calculated across all successful readings in all cycles
- Cycles must have scheduled due dates that align with billing cycle requirements
- The system must maintain history of last run date and time for each cycle
Reading Status Rules
- Each meter reading attempt must result in one of three statuses: Success, Failed, or Pending
- A reading is "Pending" when no reading attempt has been made or the attempt is still in progress
- A reading is "Failed" when an attempt was made but was unsuccessful
- A reading is "Success" when data was successfully retrieved from the meter
- For failed readings, the system must capture and categorize the failure reason
- Common failure categories include: Timeout, Connection Error, Device Offline, and others
- The system must track the total number of meters in each status category
Retry Management Rules
- Failed readings can be retried individually or in batches
- When a reading is retried, its status remains "Failed" until a successful read is achieved
- The system must maintain a history of retry attempts
- After a successful retry, the reading status should update to "Success"
- The system should allow for multiple retry attempts if needed
Consumption Calculation Rules
- Consumption is calculated as: Current Read - Last Read
- Negative consumption values should be flagged for validation
- The system must display both the current read value and the previous read value
- Unusual consumption patterns should be highlighted for review
Data Validation Rules
- Reading values must be numeric and within expected ranges for the meter type
- The current reading should be greater than or equal to the last reading, with exceptions for meter resets
- Reading timestamps must be chronologically valid
- Meter IDs must correspond to valid meters in the system
- Consumer information must be linked to valid accounts
Access Control Rules
- Meter Reading Supervisors must have full access to all cycle and meter data
- The ability to retry failed readings should be restricted to authorized personnel
- Export functionality should be available to users with reporting permissions
8. Sample Data
Meter Reading Cycles
| Cycle Name | Status | Month | Consumers | Meters | Completion | Last Run | Due Date |
|---|---|---|---|---|---|---|---|
April Cycle - Route West | In Progress | April | 6,000 | – | 75% | Apr 01, 2025 | Apr 15, 2025 |
April Cycle - Route East | Completed | April | 4,200 | – | 100% | Apr 05, 2025 | Apr 12, 2025 |
April Cycle - Route North | In Progress | April | 5,500 | – | 40% | Apr 10, 2025 | Apr 20, 2025 |
April Cycle - Route South | Completed | April | 3,800 | – | 100% | Apr 03, 2025 | Apr 10, 2025 |
April Cycle - Route Central | In Progress | April | 7,200 | – | 21% | Apr 12, 2025 | Apr 25, 2025 |
Meter Data
| Meter ID | Consumer | Premise ID | Location | Last Read | Current Read | Consumption | Status |
|---|---|---|---|---|---|---|---|
MTR100000 | Alice Brown (ACC200000) | PRE300000 | East > Residential > Block D | 92.33 | 110.87 | 18.54 | Success |
MTR100001 | Olivia Rodriguez (ACC200001) | PRE300001 | East > Industrial > Block A | 32.68 | 32.75 | 0.07 | Failed |
MTR100002 | John Rodriguez (ACC200002) | PRE300002 | North > Commercial > Block D | 984.33 | 990.20 | 5.87 | Pending |
Failure Reasons
| Failure Reason | Number of Meters |
|---|---|
Timeout | 42 |
Connection Error | 36 |
Device Offline | 27 |
Other Failures | 38 |
Total Failed Meters | 143 |
9. Acceptance Criteria
- The system must display a dashboard showing key cycle metrics including active cycles, completion rate, completed cycles, and average read time
- The system must list all meter reading cycles with their status, month, meter count, completion percentage, last run date, and due date
- The system must provide a search function that allows users to find cycles by name
- The system must allow users to view detailed information for a specific cycle by clicking on the "View" action
- The cycle detail page must show a progress bar indicating the number of completed reads versus total reads
- The system must display a read status distribution chart showing the percentage of successful, failed, and pending readings
- The system must show a route completion status visualization comparing performance across different routes
- The system must list top failure reasons with the number of affected meters for each reason
- The system must provide tabs to filter meters by status (All, Success, Failed, Pending)
- The system must include a search function to find specific meters by ID, consumer, or account
- The system must display detailed meter information including meter ID, consumer, premise ID, location, last read, current read, consumption, and status
- The system must provide a "Retry Failed" button that allows users to retry readings for selected failed meters
- The system must include an export function that allows users to download meter data in various formats
- The system must update reading statuses in real-time when retry actions are performed
- The system must calculate and display consumption values based on the difference between current and last readings
- The system must clearly indicate cycle due dates and highlight cycles that are at risk of missing deadlines
- The system must provide navigation to view all cycles from any cycle detail page
- The system must display the scheduled and actual start times for each cycle
- The system must allow filtering and sorting of meters based on multiple criteria
- The system must highlight unusual consumption patterns for further investigation
10. Process Changes
| Current Process | New Process | Impact |
|---|---|---|
Manual tracking of meter reading progress through spreadsheets or basic reports | Real-time dashboard showing cycle status, completion rates, and key metrics | Reduces tracking time by ~70% and provides up-to-date visibility |
Limited visibility into reasons for failed readings, requiring extensive investigation | Categorized failure reasons with counts and details | Improves troubleshooting efficiency by 60% through targeted resolution |
Separate systems for viewing cycle status and individual meter issues | Integrated view from cycle overview down to individual meter details | Reduces context switching by 80% and improves investigation efficiency |
Manual process for retrying failed readings through field visits or separate systems | Direct "Retry Failed" functionality from the dashboard | Decreases resolution time for failed readings by 50% via automation |
Static reports requiring manual creation and distribution | Interactive dashboards with export functionality | Reduces reporting time by 75% and improves data accuracy |
Route performance analysis requiring manual data compilation | Built-in route comparison visualizations | Enables data-driven route optimization and performance improvement |
Reactive approach to cycle completion issues | Proactive monitoring with clear due dates and completion tracking | Improves on-time cycle completion rates by 40% |
Isolated meter data requiring multiple lookups | Comprehensive meter details with consumption calculation | Reduces time to access complete meter info by 65% |
11. Impact from Solving This Problem
| Metric | Impact |
|---|---|
Cycle Completion Timeliness | Improves by 30–40% through better tracking and proactive issue resolution |
Reading Success Rate | Increases to 95%+ through better failure management |
Operational Efficiency | Reduces time spent on monitoring and troubleshooting by 60–70% |
Data Quality for Billing | Improves accuracy and completeness of meter data for billing |
Resource Allocation | Enables better scheduling and focus on problematic areas |
Revenue Assurance | Reduces unbilled consumption through better read completion rates |
Staff Productivity | Increases meters managed per staff member through better tools and visibility |
Customer Satisfaction | Improves through more accurate billing and faster issue resolution |
Analytics Capability | Enables data-driven decision making for meter reading operations |
12. User Behavior Tracking
Events to Track
| Event | Properties | Insights | Questions Answered |
|---|---|---|---|
Cycle View |
,
,
| Understanding which cycles require attention | Which cycles are being monitored most frequently? |
Meter Search |
,
,
| Identifying common search patterns | What meters/consumers are frequently investigated? |
Status Filter Applied |
,
,
| Understanding distribution of attention | How much time is spent on failed vs. successful readings? |
Retry Action |
,
,
,
| Measuring retry effectiveness | What is the success rate of retry attempts? |
Export Data |
,
,
| Understanding reporting needs | What data is being exported and how frequently? |
Route Performance View |
,
,
| Tracking focus on routes | Which routes require the most management attention? |
Failure Analysis View |
,
,
| Understanding problem prioritization | What types of failures are being investigated most? |
Dashboard Load Time |
,
,
| Measuring system performance | Is the system performing adequately for users? |
Session Duration |
,
,
| Understanding engagement | How much time do supervisors spend in the system daily? |
Feature Usage Frequency |
,
,
| Identifying valuable features | Which features are most/least used in the system? |
Metrics to Monitor
- Cycle Completion Rate Over Time
- Measures: Percentage improvement in cycle completion rates
- Question: Is the new system improving overall completion performance?
- Average Time to Resolve Failed Readings
- Measures: Time between failure detection and successful retry
- Question: Is the system enabling faster problem resolution?
- User Efficiency Metrics
- Measures: Number of actions per resolved issue
- Question: Is the system making users more efficient?
- Feature Adoption Rate
- Measures: Percentage of available features being regularly used
- Question: Are users taking advantage of all system capabilities?
- Reading Success Rate Trends
- Measures: Percentage of successful readings over time
- Question: Is the system improving the overall success rate?
Wireframe
Wireframe: :Link
Reference: Link