SMART360 System Admin Dashboard - User Story Document
1. Problem Statement
System Admins faced challenges with complex and time-consuming onboarding while setting up their organizations and utilities in SMART360. The previous lack of real-time progress tracking, actionable insights, and guided assistance led to:
- Uncertainty in setup progress, making it difficult to know how much is completed and what remains.
- Frustration and disengagement, reducing adoption rates due to a lack of transparency.
- Increased dependency on external documentation or support teams for troubleshooting and clarifications.
This inefficiency slowed down overall adoption, impacting the onboarding experience and operational readiness.
Pain points
- Pain Point 1: Lack of real-time progress tracking makes it difficult to determine completion status for organization and utility setup processes.
- Pain Point 2: Absence of actionable insights during setup creates dependency on external documentation or support teams.
- Pain Point 3: Limited visibility into user adoption metrics and security activity makes it challenging to monitor system health.
- Pain Point 4: Unclear progression path between setup stages causes disengagement and reduced adoption rates.
2. Who Are the Users Facing the Problem?
System Admin
Description: Responsible for configuring and maintaining the SMART360 platform, including organization setup, utility setup, user permissions, and monitoring overall system health and adoption.
Access Permissions: Full access to the System Admin Dashboard including organization setup, utility setup, user adoption metrics, security activity monitoring, and subscription management.
3. Jobs To Be Done
System Admin
Job 1: When I need to complete the organization setup process, But I am uncertain about which steps I've completed and what remains, Help me track my progress with clear visual indicators and step-by-step guidance, So that I can efficiently configure all necessary organization settings without relying on external support.
Job 2: When I need to monitor user adoption and security activities, But I lack real-time insights and actionable data, Help me visualize key metrics and identify potential issues with comprehensive dashboards, So that I can proactively address adoption challenges and security concerns.
4. Solution
Comprehensive Progress Tracking System
- Visual Progress Indicators: Implement clear percentage completion bars for both Organization Setup (75%) and Utility Setup (50%), providing instant visibility into overall progress.
- Status Checkmarks: Add visual checkmarks for completed tasks and different indicators for pending tasks to show status at a glance.
- Categorized Setup Sections: Organize setup tasks into logical categories (Organization details, Address information, User invitations, Configure permissions) to chunk the process into manageable segments.
Guided Setup Assistance
- Step-by-Step Navigation: Implement "Complete Setup" button that guide admins through the logical sequence of configuration steps.
Real-Time Metrics Dashboard
- User Adoption Tracking: Display daily active users with trend visualization to monitor engagement over time.
- Growth Indicators: Show week-over-week growth metrics (+15%) to highlight adoption trends.
- Current User Count: Provide the exact number of active users (48) for precise monitoring.
Security Monitoring Center
- Authentication Activity: Display login attempts broken down by day and status (authorized, unauthorized).
- Security Alerts: Highlight security incidents with color-coded severity indicators (green,
yellow,red). - Incident Metrics: Show total authorized sessions (162 logins) and security concerns (15 unauthorized attempts) for quick assessment.
Subscription Management Tools
- Tiered Subscription Overview: Provide clear visibility into current plan and billing information.
- Component-Based Pricing: Break down costs by feature set ($90 for Smart Workforce, $120 for Smart Utility).
- Upgrade Pathways: Show available plan options for easy comparison and potential upgrades.
Intelligent Setup Recommendations
- Completion Estimates: Show estimated time to complete each remaining section.
5. Major Steps Involved
Organization Setup Process
- Access Dashboard: System Admin logs into SMART360 and views the System Admin Dashboard.
- Review Organization Setup Progress: Admin observes the 75% completion status in the Organization Setup section.
- Identify Pending Tasks: Admin notes that "User invitations (2 pending)" still requires attention.
Access Organization Setup:Admin clicks on the Organization Setup section to expand details.- Complete User Invitations: Admin navigates to the User invitations task and adds the pending invitations. -----
- Verify Completion: Admin confirms that the user invitations have been sent and the task is now complete. -----
- Finalize Setup: Admin clicks "Complete Setup" button after addressing all pending organization tasks.
- Receive Confirmation: System displays confirmation that Organization Setup is now 100% complete.
- when user can click on the " complete setup " button , the button will navigate it to the organization setup page -
Utility Setup Process
User Adoption Monitoring
- View Adoption Metrics: Admin reviews the User Adoption section showing daily active users.
- Analyze Trends: Admin examines the user activity graph spanning Monday through Sunday.
- Note Growth Metrics: Admin observes the +15% week-over-week growth indicator.
- Identify Low Activity Days: Admin notes lower activity on Saturday and Sunday.
Security Activity Monitoring
- Review Security Overview: Admin examines the Security Activity section showing login attempts.
- Analyze Authentication Patterns: Admin reviews the daily breakdown of login attempts.
- Identify Security Concerns: Admin notes days with higher unauthorized attempts.
- Investigate Unauthorized Attempts: Admin clicks on the unauthorized attempts (15) for detailed information.
- Review Authorized Sessions: Admin confirms the total of 162 successful logins.
6. Flow Diagram
7. Business Rules
General Rules
- Progress Calculation: Progress percentages must be calculated based on the weighted importance of each task, not just the count of completed tasks.
OrgOrganization setup
has-3Task
Weightage
steps(%)Reasoning
Currency
40%
Currency
-->selection100/3impacts=financial33%transactions,completedpricing,ifbilling,1andtaskreporting. Setting this correctly iscompletedcrucialbytouser- avoid
Utilityinconsistenciessetupinhasfinancial6operations.Date
stepsFormat30%
The
-->date100/6 = 16% completed if 1 taskformat iscompletedessentialbyforuserscheduling, reporting, and compliance. Incorrect configurations can lead to misinterpretations of dates in critical documents.Timezone
30%
The timezone setting is necessary for scheduling, service operations, and system logs. Mismatched time zones can cause issues in appointments, customer interactions, and workflow automation.
Utility Setup -
Task
Weightage (%)
Reasoning
Core System Settings
25%
This forms the foundation of the system, ensuring all essential configurations are set up correctly before proceeding with other tasks.
Staff and Access Control
15%
Managing roles and access control is critical for security and efficient system usage but can be updated later as needed.
Calendar and Scheduling
10%
Scheduling affects operational efficiency but may not be a blocker for initial setup.
Service Area
20%
Defining the service area is crucial for utility operations, impacting customer assignments and service coverage.
Pricing and Billing
20%
Accurate pricing and billing are essential for revenue generation and financial accuracy, making this a high-priority setup.
IDs and Reference Numbers
10%
These are important for tracking and reporting but are typically supplementary to core operations.
User Adoption Rules
- Activity Definition: A "daily active user" is defined as a user who has logged in.
Error Handling RulesValidation Errors:All input validation errors must display specific error messages adjacent to the relevant field. ( example - IF Organization setup is not completed - complete it 25% )
8. Acceptance Criteria
- The system must display accurate progress percentages for both Organization Setup and Utility Setup based on completed tasks.
- The system must visually distinguish between completed, in-progress, and pending tasks using appropriate indicators (checkmarks, icons).
- The system must provide a "Complete Setup" button for Organization Setup that is only enabled when all required tasks are finished.
- The system must provide a "Continue Setup" button for Utility Setup that directs users to the next incomplete task.
- The system must display the exact count of pending user invitations (e.g., "User invitations").
- The system must display the current day's active user count prominently.
- The system must present security activity data in a daily breakdown showing authorized and unauthorized login attempts.
- The system must show the total count of authorized logins and unauthorized attempts.
- The system must display current subscription information including plan type and costs.
- The system must allow navigation between different dashboard sections (Overview, Organization Setup, Utility Setup, Integrations) without losing progress.
- The system must restrict access to the admin dashboard based on user role permissions.
- The system must ensure all dashboard metrics update in real-time or with a clearly indicated refresh interval.
9. Process Changes
From: Manual tracking of setup progress through documentation or checklists
To: Real-time visual progress indicators with percentage completion and status checkmarks
Impact: Reduces uncertainty, provides immediate visibility into progress, and decreases time spent referencing external documentation.
From: Security monitoring issues
To: Proactive visualization of security activities with clear categorization
Impact: Enables earlier detection of potential security issues, reduces unauthorized access incidents.
From: Limited visibility into user adoption patterns
To: Comprehensive adoption metrics with trend analysis and growth indicators
Impact: Allows admins to identify adoption barriers, target interventions, and measure the effectiveness of engagement initiatives.
From: Linear setup process with unclear dependencies
To: Categorized setup tasks with clear progression paths and contextual navigation
Impact: Reduces setup abandonment, decreases time-to-complete and improves the quality of the resulting configuration.
From: Subscription and billing information
To: Consolidated subscription overview with component-based cost breakdown
Impact: Improves transparency in billing, reduces billing-related inquiries and facilitates informed decisions about plan upgrades or changes.
10. System Design Details
New Components
Progress Tracking Engine
- Purpose: Calculate and display setup progress metrics based on task completion status
- Functions: Weighted progress calculation, persistence of completion state, visual representation of progress
Metrics Visualization Module
- Purpose: Generate and display user adoption and security activity charts
- Functions: Data aggregation, trend calculation, graphical representation of metrics
Subscription Management Component
- Purpose: Display and manage subscription information
- Functions: Component cost breakdown, upgrade path definition
Task Prioritization Module
- Purpose: Identify and highlight pending tasks requiring admin attention
- Functions: Task status tracking, priority determination, notification generation
11. Impact from Solving This Problem
Metric
Before
After
Improvement
Faster Onboarding Completion
Users were unaware of pending setup tasks, leading to delays.
Users now have a structured progress bar guiding them. Onboarding completes more quickly.
Progress visibility reduces onboarding time by minimizing confusion and drop-offs.
Reduced Abandonment Rate
Many users abandoned onboarding due to a lack of clear next steps.
Step-by-step progress guidance ensures an increase in setup completion.
Progress tracking improves task completion as users stay engaged with clear goals.
Security Incident Response Time
Security incidents were hard to track, leading to delayed resolutions.
Clear visualization of security events ensures faster response time.
Faster response time improves system security and user trust.
Enhanced User Engagement
Users felt lost and frustrated without clear onboarding indicators.
Visual indicators improve confidence, leading to increased engagement.
Progress bars, tracking boosts engagement.
Faster Revenue Activation
Delayed setup completion meant late operational readiness and billing.
Clear progress visibility ensures faster revenue realization.
Faster onboarding directly impacts time-to-value.
10. User Behavior Tracking - System Admin
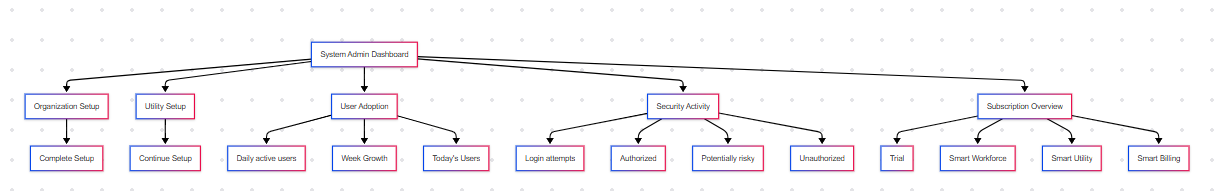
Description : The System Admin landing page provides a high-level overview of organization setup, utility setup, ongoing tasks, and system modules.
Objective :
- Track how System Admins interact with the setup process.
- Measure engagement with process status and system modules.
- Identify friction points in organization/utility setup.
- Understand which modules are frequently accessed from the landing page.
Event
Description
Key Properties
Metrics To Track
Viewed_Landing_Page
When the System Admin visits the landing page.
timestamp,user_id,roleDAU/WAU of System Admins
Clicked_Edit_Org_Details
Click on “Enter/Edit Org Details.”
org_id,user_idClick rate on Org Setup
Completed_Org
Successfully enters and saves organization details.
org_id,completion_time,fields_filledSetup completion rate, Time to complete
Clicked_Edit_Utility_Details
Click on “Enter/Edit Utility Details.”
utility_id,user_idClick rate on Utility Setup
Completed_Utility_Setup
Successfully enters and saves utility details.
utility_id,completion_time,fields_filledSetup completion rate, Time to complete
Viewed_Data_Upload
Opened the Data Upload section.
user_id
Engagement with data upload section
Clicked_Upload_Files
Clicked on "Upload Files" in Data Upload.
user_id,file_count,file_sizeClick rate on Upload Files, Number of files uploaded
Viewed_Subscription_Overview
Opened the Subscription Overview section.
user_idEngagement with subscription details
- avoid