SMART360 System Admin Dashboard - User Story Document
1. Problem Statement
System Admins faced challenges with complex and time-consuming onboarding while setting up their organizations and utilities in SMART360. The previous lack of real-time progress tracking, actionable insights, and guided assistance led to:
- Uncertainty in setup progress, making it difficult to know how much is completed and what remains.
- Frustration and disengagement, reducing adoption rates due to a lack of transparency.
- Increased dependency on external documentation or support teams for troubleshooting and clarifications.
This inefficiency slowed down overall adoption, impacting the onboarding experience and operational readiness.
Pain points
- Pain Point 1: Lack of real-time progress tracking makes it difficult to determine completion status for organization and utility setup processes.
- Pain Point 2: Absence of actionable insights during setup creates dependency on external documentation or support teams.
- Pain Point 3: Limited visibility into user adoption metrics and security activity makes it challenging to monitor system health.
- Pain Point 4: Unclear progression path between setup stages causes disengagement and reduced adoption rates.
2. Who Are the Users Facing the Problem?
System Admin
Description: Responsible for configuring and maintaining the SMART360 platform, including organization setup, utility setup, user permissions, and monitoring overall system health and adoption.
Access Permissions: Full access to the System Admin Dashboard including organization setup, utility setup, user adoption metrics, security activity monitoring, and subscription management.
3. Jobs To Be Done
System Admin
Job 1: When I need to complete the organization setup process, But I am uncertain about which steps I've completed and what remains, Help me track my progress with clear visual indicators and step-by-step guidance, So that I can efficiently configure all necessary organization settings without relying on external support.
Job 2: When I need to monitor user adoption and security activities, But I lack real-time insights and actionable data, Help me visualize key metrics and identify potential issues with comprehensive dashboards, So that I can proactively address adoption challenges and security concerns.
4. Solution
Comprehensive Progress Tracking System
- Visual Progress Indicators: Implement clear percentage completion bars for both Organization Setup (75%) and Utility Setup (50%), providing instant visibility into overall progress.
- Status Checkmarks: Add visual checkmarks for completed tasks and different indicators for pending tasks to show status at a glance.
- Categorized Setup Sections: Organize setup tasks into logical categories (Organization details, Address information, User invitations, Configure permissions) to chunk the process into manageable segments.
Guided Setup Assistance
- Step-by-Step Navigation: Implement "Complete Setup" button that guide admins through the logical sequence of configuration steps.
Real-Time Metrics Dashboard
- User Adoption Tracking: Display daily active users with trend visualization to monitor engagement over time.
- Growth Indicators: Show week-over-week growth metrics (+15%) to highlight adoption trends.
- Current User Count: Provide the exact number of active users (48) for precise monitoring.
Security Monitoring Center
- Authentication Activity: Display login attempts broken down by day and status (authorized, unauthorized).
- Security Alerts: Highlight security incidents with color-coded severity indicators (green, red).
- Incident Metrics: Show total authorized sessions (162 logins) and security concerns (15 unauthorized attempts) for quick assessment.
Subscription Management Tools
- Tiered Subscription Overview: Provide clear visibility into current plan and billing information.
- Component-Based Pricing: Break down costs by feature set ($90 for Smart Workforce, $120 for Smart Utility).
- Upgrade Pathways: Show available plan options for easy comparison and potential upgrades.
Intelligent Setup Recommendations
- Completion Estimates: Show estimated time to complete each remaining section.
5. Major Steps Involved
Organization Setup Process
- Access Dashboard: System Admin logs into SMART360 and views the System Admin Dashboard.
- Review Organization Setup Progress: Admin observes the 75% completion status in the Organization Setup section.
- Identify Pending Tasks: Admin notes that "User invitations (2 pending)" still requires attention.
- Complete User Invitations: Admin navigates to the User invitations task and adds the pending invitations. ( inside the organization setup page )
- Finalize Setup: Admin clicks "Complete Setup" button after addressing all pending organization tasks.
- Receive Confirmation: System displays confirmation that Organization Setup is now 100% complete.
- when user can click on the " complete setup " button , the button will navigate it to the organization setup page - Org setup link
Utility Setup Process
User Adoption Monitoring
- View Adoption Metrics: Admin reviews the User Adoption section showing daily active users.
- Analyze Trends: Admin examines the user activity graph spanning Monday through Sunday.
- Note Growth Metrics: Admin observes the +15% week-over-week growth indicator.
- Identify Low Activity Days: Admin notes lower activity on Saturday and Sunday.
Security Activity Monitoring
- Review Security Overview: Admin examines the Security Activity section showing login attempts.
- Analyze Authentication Patterns: Admin reviews the daily breakdown of login attempts.
- Identify Security Concerns: Admin notes days with higher unauthorized attempts.
- Investigate Unauthorized Attempts: Admin clicks on the unauthorized attempts (15) for detailed information.
- Review Authorized Sessions: Admin confirms the total of 162 successful logins.
6. Flow Diagram
7. Business Rules
General Rules
- Progress Calculation: Progress percentages must be calculated based on the weighted importance of each task, not just the count of completed tasks.
Organization setup -
Task | Weightage (%) | Reasoning |
Currency | 40% | Currency selection impacts financial transactions, pricing, billing, and reporting. Setting this correctly is crucial to avoid inconsistencies in financial operations. |
Date Format | 30% | The date format is essential for scheduling, reporting, and compliance. Incorrect configurations can lead to misinterpretations of dates in critical documents. |
Timezone | 30% | The timezone setting is necessary for scheduling, service operations, and system logs. Mismatched time zones can cause issues in appointments, customer interactions, and workflow automation. |
Utility Setup -
Task | Weightage (%) | Reasoning |
Core System Settings | 25% | This forms the foundation of the system, ensuring all essential configurations are set up correctly before proceeding with other tasks. |
Staff and Access Control | 15% | Managing roles and access control is critical for security and efficient system usage but can be updated later as needed. |
Calendar and Scheduling | 10% | Scheduling affects operational efficiency but may not be a blocker for initial setup. |
Service Area | 20% | Defining the service area is crucial for utility operations, impacting customer assignments and service coverage. |
Pricing and Billing | 20% | Accurate pricing and billing are essential for revenue generation and financial accuracy, making this a high-priority setup. |
IDs and Reference Numbers | 10% | These are important for tracking and reporting but are typically supplementary to core operations. |
User Adoption Rules
- Activity Definition: A "daily active user" is defined as a user who has logged in.
8. Acceptance Criteria
- The system must display accurate progress percentages for both Organization Setup and Utility Setup based on completed tasks.
- The system must visually distinguish between completed, in-progress, and pending tasks using appropriate indicators (checkmarks, icons).
- The system must provide a "Complete Setup" button for Organization Setup that is only enabled when all required tasks are finished.
- The system must provide a "Continue Setup" button for Utility Setup that directs users to the next incomplete task.
- The system must display the current day's active user count prominently.
- The system must present security activity data in a daily breakdown showing authorized and unauthorized login attempts.
- The system must show the total count of authorized logins and unauthorized attempts.
- The system must display current subscription information including plan type and costs.
- The system must restrict access to the admin dashboard based on user role permissions.
- The system must ensure all dashboard metrics update in real-time or with a clearly indicated refresh interval.
9. Process Changes
From: Manual tracking of setup progress through documentation or checklists
To: Real-time visual progress indicators with percentage completion and status checkmarks
Impact: Reduces uncertainty, provides immediate visibility into progress, and decreases time spent referencing external documentation.
From: Security monitoring issues
To: Proactive visualization of security activities with clear categorization
Impact: Enables earlier detection of potential security issues, reduces unauthorized access incidents.
From: Limited visibility into user adoption patterns
To: Comprehensive adoption metrics with trend analysis and growth indicators
Impact: Allows admins to identify adoption barriers, target interventions, and measure the effectiveness of engagement initiatives.
From: Linear setup process with unclear dependencies
To: Categorized setup tasks with clear progression paths and contextual navigation
Impact: Reduces setup abandonment, decreases time-to-complete and improves the quality of the resulting configuration.
From: Subscription and billing information
To: Consolidated subscription overview with component-based cost breakdown
Impact: Improves transparency in billing, reduces billing-related inquiries and facilitates informed decisions about plan upgrades or changes.
10. System Design Details
New Components
Progress Tracking Engine
- Purpose: Calculate and display setup progress metrics based on task completion status
- Functions: Weighted progress calculation, persistence of completion state, visual representation of progress
Metrics Visualization Module
- Purpose: Generate and display user adoption and security activity charts
- Functions: Data aggregation, trend calculation, graphical representation of metrics
Subscription Management Component
- Purpose: Display and manage subscription information
- Functions: Component cost breakdown, upgrade path definition
Task Prioritization Module
- Purpose: Identify and highlight pending tasks requiring admin attention
- Functions: Task status tracking, priority determination, notification generation
11. Impact from Solving This Problem
Metric | Before | After | Improvement |
Faster Onboarding Completion | Users were unaware of pending setup tasks, leading to delays. | Users now have a structured progress bar guiding them. Onboarding completes more quickly. | Progress visibility reduces onboarding time by minimizing confusion and drop-offs. |
Reduced Abandonment Rate | Many users abandoned onboarding due to a lack of clear next steps. | Step-by-step progress guidance ensures an increase in setup completion. | Progress tracking improves task completion as users stay engaged with clear goals. |
Security Incident Response Time | Security incidents were hard to track, leading to delayed resolutions. | Clear visualization of security events ensures faster response time. | Faster response time improves system security and user trust. |
Enhanced User Engagement | Users felt lost and frustrated without clear onboarding indicators. | Visual indicators improve confidence, leading to increased engagement. | Progress bars, tracking boosts engagement. |
Faster Revenue Activation | Delayed setup completion meant late operational readiness and billing. | Clear progress visibility ensures faster revenue realization. | Faster onboarding directly impacts time-to-value. |
10. User Behavior Tracking - System Admin
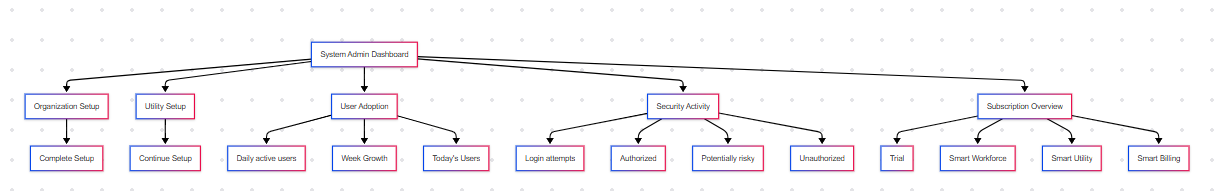
Description : The System Admin landing page provides a high-level overview of organization setup, utility setup, ongoing tasks, and system modules.
Objective :
- Track how System Admins interact with the setup process.
- Measure engagement with process status and system modules.
- Identify friction points in organization/utility setup.
- Understand which modules are frequently accessed from the landing page.
Event | Description | Key Properties | Metrics To Track |
Viewed_Landing_Page | When the System Admin visits the landing page. |
| DAU/WAU of System Admins |
Clicked_Edit_Org_Details | Click on “Enter/Edit Org Details.” |
| Click rate on Org Setup |
Completed_Org | Successfully enters and saves organization details. |
| Setup completion rate, Time to complete |
Clicked_Edit_Utility_Details | Click on “Enter/Edit Utility Details.” |
| Click rate on Utility Setup |
Completed_Utility_Setup | Successfully enters and saves utility details. |
| Setup completion rate, Time to complete |
Viewed_Data_Upload | Opened the Data Upload section. | user_id | Engagement with data upload section |
Clicked_Upload_Files | Clicked on "Upload Files" in Data Upload. |
| Click rate on Upload Files, Number of files uploaded |
Viewed_Subscription_Overview | Opened the Subscription Overview section. |
| Engagement with subscription details |
No Comments