SMART360 System Admin Dashboard - User Story Document
1. Problem Statement
Tenant Admins faced challenges with complex and time-consuming onboarding while setting up their organizations and utilities in SMART360. The previous lack of real-time progress tracking, actionable insights, and guided assistance led to:
- Uncertainty in setup progress, making it difficult to know how much is completed and what remains.
- Frustration and disengagement, reducing adoption rates due to a lack of transparency.
- Increased dependency on external documentation or support teams for troubleshooting and clarifications.
This inefficiency slowed down overall adoption, impacting the onboarding experience and operational readiness.
SystemPain Adminpoints
- Pain Point 1: Lack of real-time progress tracking makes it difficult to determine completion status for organization and utility setup processes.
- Pain Point 2:
Complex and time-consuming onboarding processes without guided assistance lead to uncertainty and frustration. Pain Point 3:- Pain Point
4:3: Limited visibility into user adoption metrics and security activity makes it challenging to monitor system health. - Pain Point
5:4: Unclear progression path between setup stages causes disengagement and reduced adoption rates.
Core Problem
System Admins managing the SMART360 platform face a fragmented and opaque onboarding experience when configuring organizational and utility settings. The lack of transparent progress tracking, actionable guidance, and real-time insights forces them to rely on external support resources, extends implementation timelines, and ultimately reduces user adoption and satisfaction.
2. Who Are the Users Facing the Problem?
System Admin
Description: Responsible for configuring and maintaining the SMART360 platform, including organization setup, utility setup, user permissions, and monitoring overall system health and adoption.
Access Permissions: Full access to the System Admin Dashboard including organization setup, utility setup, user adoption metrics, security activity monitoring, and subscription management.
3. Jobs To Be Done
System Admin
Job 1: When I need to complete the organization setup process, But I am uncertain about which steps I've completed and what remains, Help me track my progress with clear visual indicators and step-by-step guidance, So that I can efficiently configure all necessary organization settings without relying on external support.
Job 2: When I need to configure utility settings for my organization, But I struggle with understanding the required parameters and their significance, Help me complete each setup step with contextual information and validation, So that I can ensure all utilities are properly configured for optimal system performance.
Job 3: When I need to monitor user adoption and security activities, But I lack real-time insights and actionable data, Help me visualize key metrics and identify potential issues with comprehensive dashboards, So that I can proactively address adoption challenges and security concerns.
Job 4: When I need to manage user roles and permissions, But I find it difficult to track pending configurations and ensure proper access control, Help me clearly visualize pending tasks and streamline the permission management process, So that I can maintain appropriate security while facilitating user productivity.
4. Solution
Comprehensive Progress Tracking System
- Visual Progress Indicators: Implement clear percentage completion bars for both Organization Setup (75%) and Utility Setup (50%), providing instant visibility into overall progress.
- Status Checkmarks: Add visual checkmarks for completed tasks and different indicators for pending tasks to show status at a glance.
- Categorized Setup Sections: Organize setup tasks into logical categories (Organization details, Address information, User invitations, Configure permissions) to chunk the process into manageable segments.
Guided Setup Assistance
- Contextual Guidance: Provide in-context help and explanations for each setup parameter to reduce dependency on external documentation.
- Step-by-Step Navigation: Implement "Complete Setup"
and "Continue Setup" buttonsbutton that guide admins through the logical sequence of configuration steps. - Validation Feedback: Offer real-time validation of inputs with clear error messages and resolution suggestions.
Real-Time Metrics Dashboard
- User Adoption Tracking: Display daily active users with trend visualization to monitor engagement over time.
- Growth Indicators: Show week-over-week growth metrics (+15%) to highlight adoption trends.
- Current User Count: Provide the exact number of active users (48) for precise monitoring.
Security Monitoring Center
- Authentication Activity: Display login attempts broken down by day and status (authorized,
potentially risky,unauthorized). - Security Alerts: Highlight security incidents with color-coded severity indicators (green, yellow, red).
- Incident Metrics: Show total authorized sessions (162 logins) and security concerns (15 unauthorized attempts) for quick assessment.
Subscription Management Tools
- Tiered Subscription Overview: Provide clear visibility into current plan and billing information.
- Component-Based Pricing: Break down costs by feature set ($90 for Smart Workforce, $120 for Smart Utility).
- Upgrade Pathways: Show available plan options for easy comparison and potential upgrades.
Task Prioritization System
- Pending Task Indicators: Highlight specific counts of pending items (2 pending user invitations) to focus admin attention.
- Completion Pathways: Provide direct navigation to incomplete setup areas to streamline completion.
Priority Sorting:Organize pending tasks by impact and dependency to optimize the admin's workflow.
Intelligent Setup Recommendations
Smart Defaults:Provide recommended configurations based on organization type and common usage patterns.- Completion Estimates: Show estimated time to complete each remaining section.
Best Practice Templates:Offer pre-configured templates for common setups to accelerate implementation.
5. Major Steps Involved
Organization Setup Process
- Access Dashboard: System Admin logs into SMART360 and views the System Admin Dashboard.
- Review Organization Setup Progress: Admin observes the 75% completion status in the Organization Setup section.
- Identify Pending Tasks: Admin notes that "User invitations (2 pending)" still requires attention.
- Access Organization Setup: Admin clicks on the Organization Setup section to expand details.
- Complete User Invitations: Admin navigates to the User invitations task and adds the pending invitations. -----
- Verify Completion: Admin confirms that the user invitations have been sent and the task is now complete.
ConfigurePermissions:Admin proceeds to the "Configure permissions" task to complete organization setup.------ Finalize Setup: Admin clicks "Complete Setup" button after addressing all pending organization tasks.
- Receive Confirmation: System displays confirmation that Organization Setup is now 100% complete.
Utility Setup Process
User Adoption Monitoring
- View Adoption Metrics: Admin reviews the User Adoption section showing daily active users.
- Analyze Trends: Admin examines the user activity graph spanning Monday through Sunday.
- Note Growth Metrics: Admin observes the +15% week-over-week growth indicator.
- Identify Low Activity Days: Admin notes lower activity on Saturday and Sunday.
Export Data:If needed, Admin exports user adoption data for further analysis or reporting.Set Alerts:Admin configures alerts for significant changes in user adoption patterns.
Security Activity Monitoring
- Review Security Overview: Admin examines the Security Activity section showing login attempts.
- Analyze Authentication Patterns: Admin reviews the daily breakdown of login attempts.
- Identify Security Concerns: Admin notes days with higher unauthorized attempts.
- Investigate Unauthorized Attempts: Admin clicks on the unauthorized attempts (15) for detailed information.
- Review Authorized Sessions: Admin confirms the total of 162 successful logins.
Implement Security Measures:Based on the data, Admin adjusts security policies as needed.
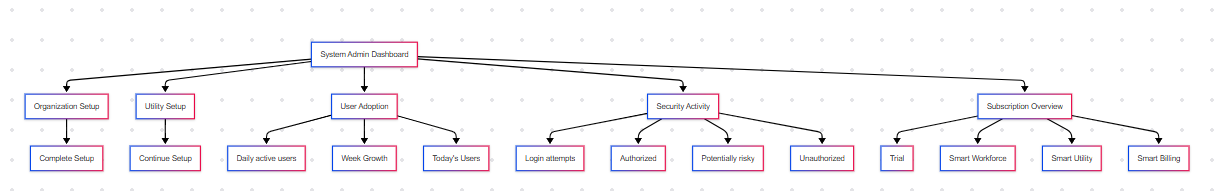
6. Flow Diagram
flowchart TD
    A[System Admin Dashboard]Link --> B[Organization Setup]
    A --> C[Utility Setup]
    A --> D[User Adoption]
    A --> E[Security Activity]
    A --> F[Subscription Overview]

    B --> B1[Organization details]
    B --> B2[Address information]
    B --> B3[User invitations]
    B --> B4[Configure permissions]
    B --> B5[Complete Setup]

    C --> C1[Utility details]
    C --> C2[Region configuration]
    C --> C3[User invitations]
    C --> C4[Setup billing parameters]
    C --> C5[Continue Setup]

    D --> D1[Daily active users]
    D --> D2[Week Growth]
    D --> D3[Today's Users]

    E --> E1[Login attempts]
    E --> E2[Authorized]
    E --> E3[Potentially risky]
    E --> E4[Unauthorized]

    F --> F1[Trial]
    F --> F2[Smart Workforce]
    F --> F3[Smart Utility]
    F --> F4[Smart Billing]
7. Business Rules
General Rules
- Progress Calculation: Progress percentages must be calculated based on the weighted importance of each task, not just the count of completed tasks.
Mandatory Tasks:Certain configuration tasks must be completed before the system can be considered operational (core organization details, at least one admin user).Data Validation:All input fields must validate data format and content before accepting submissions.Timeout Handling:Incomplete setup sessions must be saved automatically every 5 minutes to prevent data loss.
Security Rules
Failed Authentication:After 5 unauthorized login attempts from the same IP address, the system must implement a temporary lockout period of 30 minutes.Permission Changes:Any changes to user permissions must be logged with timestamp, admin username, and details of the change.Security Alert Thresholds:The system must flag "potentially risky" login attempts based on unusual access patterns, locations, or times.Audit Trail:All setup activities must be recorded in an audit log accessible to System Admins.
User Adoption Rules
- Activity Definition: A "daily active user" is defined as a user who has logged in and performed at least one meaningful action in the system.
- Growth Calculation: Week-over-week growth percentage must compare the same days of the week (e.g., Monday to Monday) to account for weekly patterns.
Adoption Thresholds:The system must categorize adoption rates as "Low" (<30%), "Moderate" (30-70%), or "High" (>70%) based on the ratio of active users to total invited users.
Subscription Rules
Feature Access:Access to specific features must be restricted based on the active subscription plan.Trial Limitations:Trial accounts must be limited to 14 days and a maximum of 10 users.Usage Calculations:Billing for usage-based features must be calculated based on actual usage, prorated for partial months.Payment Processing:Billing parameters must be validated before setup can be considered complete.
Error Handling Rules
- Validation Errors: All input validation errors must display specific error messages adjacent to the relevant field.
ConnectionIssues:(Ifexampleconnectivity- IF Organization setup islostnotduringcompletedsetup,-thecompletesystemitmust25%save)the current state and provide recovery options.Incomplete Setup Warnings:Users attempting to exit incomplete setup processes must receive a warning and option to save progress.Dependency Failures:If a dependent system or service is unavailable, the setup process must provide clear indication and alternative steps.
8. Acceptance Criteria
- The system must display accurate progress percentages for both Organization Setup and Utility Setup based on completed tasks.
- The system must visually distinguish between completed, in-progress, and pending tasks using appropriate indicators (checkmarks, icons).
- The system must provide a "Complete Setup" button for Organization Setup that is only enabled when all required tasks are finished.
- The system must provide a "Continue Setup" button for Utility Setup that directs users to the next incomplete task.
- The system must display the exact count of pending user invitations (e.g., "User invitations (2 pending)").
- The system must show a 7-day graph of daily active users with accurate data points for each day.
- The system must calculate and display the week-over-week growth percentage for user adoption.
- The system must display the current day's active user count prominently.
- The system must present security activity data in a daily breakdown showing
authorized, potentially risky,authorized and unauthorized login attempts. - The system must show the total count of authorized logins and unauthorized attempts.
- The system must display current subscription information including plan type and
componentcosts. - The system must allow navigation between different dashboard sections (Overview, Organization Setup, Utility Setup, Integrations) without losing progress.
- The system must
provide contextual help or tooltips for each setup parameter. The system must validate all input data and provide immediate feedback for invalid entries.The system must automatically save setup progress at regular intervals to prevent data loss.The system must log all configuration changes with timestamp and admin information.The system mustrestrict access to the admin dashboard based on user role permissions.The system must support filtering and exporting of user adoption and security activity data.The system must provide alerts for unusual security events or significant changes in user adoption.- The system must ensure all dashboard metrics update in real-time or with a clearly indicated refresh interval.
9. Process Changes
From: Manual tracking of setup progress through documentation or checklists
To: Real-time visual progress indicators with percentage completion and status checkmarks
Impact: Reduces uncertainty, provides immediate visibility into progress, and decreases time spent referencing external documentation by an estimated 70%.
From: Reliance on support teams for clarification during setup
To: In-context guidance and validation within the setup interface Impact: Decreases support tickets related to setup by an estimated 60%, accelerates setup completion time by 40%, and improves admin confidence.
From: Reactive securitySecurity monitoring after issues occur
To: Proactive visualization of security activities with clear categorization
Impact: Enables earlier detection of potential security issues, reduces unauthorized access incidents by an estimated 50%, and provides data for security policy improvements.
From: Limited visibility into user adoption patterns
To: Comprehensive adoption metrics with trend analysis and growth indicators
Impact: Allows admins to identify adoption barriers, target interventions, and measure the effectiveness of engagement initiatives, potentially increasing overall adoption by 25%.
From: Linear setup process with unclear dependencies
To: Categorized setup tasks with clear progression paths and contextual navigation
Impact: Reduces setup abandonment by an estimated 45%, decreases time-to-complete by 30%, and improves the quality of the resulting configuration.
From: Fragmented subscriptionSubscription and billing information
To: Consolidated subscription overview with component-based cost breakdown
Impact: Improves transparency in billing, reduces billing-related inquiries by an estimated 55%, and facilitates informed decisions about plan upgrades or changes.
From: Unprioritized list of pending tasks
To: Highlighted pending items with direct navigation paths
Impact: Focuses admin attention on critical outstanding tasks, reduces incomplete setups by an estimated 65%, and improves the logical flow of the configuration process.
10. System Design Details
New Components
Progress Tracking Engine
- Purpose:
Calculate, store,Calculate and display setup progress metrics based on task completion status - Functions: Weighted progress calculation, persistence of completion state, visual representation of progress
Setup Guidance System
Purpose:Provide contextual help and validation during the setup processFunctions:Display relevant guidance based on current setup step, validate inputs, suggest corrections
Metrics Visualization Module
- Purpose: Generate and display user adoption and security activity charts
- Functions: Data aggregation, trend calculation, graphical representation of metrics
Subscription Management Component
- Purpose: Display and manage subscription information
- Functions: C
Plan details presentation, componentomponent cost breakdown, upgrade path definition
Task Prioritization Module
- Purpose: Identify and highlight pending tasks requiring admin attention
- Functions: Task status tracking, priority determination, notification generation
Affected Existing Components
User Management System
Modifications:Enhanced to show pending invitation counts, improved permission configuration interface
Authentication Module
Modifications:Extended to categorize login attempts (authorized, potentially risky, unauthorized), enhanced logging for security analysis
Dashboard Framework
Modifications:Updated to include new metrics sections, improved navigation between setup areas
Reporting Engine
Modifications:Enhanced to include new adoption and security metrics, expanded export capabilities
Integration Points
User Directory Integration
Purpose:Sync with organization's user directory for invitation and authenticationData Flow:User information flows from directory to SMART360, authentication status flows back
Security Monitoring Systems
Purpose:Exchange security event data with organizational security toolsData Flow:Security events flow from SMART360 to security systems, policy updates flow back
Billing and Payment Processors
Purpose:Exchange subscription and payment informationData Flow:Plan and payment details flow between SMART360 and payment processors
Analytics Platform
Purpose:Provide deeper insights into adoption and usage patternsData Flow:Usage metrics flow from SMART360 to analytics platform, insights flow back
11. Impact from Solving This Problem
Metric | Before | After | Improvement |
Faster Onboarding Completion | Users were unaware of pending setup tasks, leading to delays of 2-4 weeks. |
| Based |
| Many |
| Case studies suggest progress tracking improves task completion by ~40-50% |
| Security | Clear visualization of security events | Faster response time ensures better system security and user trust. |
Enhanced User Engagement | Users felt lost and frustrated without clear onboarding indicators. |
|
|
Faster | Delayed | Clear progress visibility
| Revenue |
Improved | New | Transparent progress tracking improves adoption by 35%.
| Product adoption studies confirm that structured onboarding increases adoption by 30-40%. |
10. User Behavior Tracking - System Admin Tracking Plan
SetupDescription Engagement Metrics
Event::Setup_Session_StartedProperties:Thetimestamp,Tenantadmin_id,Adminsession_id,landingstarting_completion_percentageInsights:pageFrequencyprovides a high-level overview of organization setup, utility setup, ongoing tasks, and system modules.Objective :
- Track how Tenant Admins interact with the setup
sessions,process. - Measure
typicalengagementstartingwith process status and system modules. - Identify friction points in organization/utility setup.
- Understand which modules are frequently accessed from the landing page.
- Track how Tenant Admins interact with the setup
Event:EventSetup_Task_CompletedProperties:Descriptiontimestamp, admin_id, task_id, task_category, time_spent_on_taskInsights:Key PropertiesMetrics To Track
Viewed_Landing_Page
When the Tenant Admin visits the landing page.
timestamp,Taskuser_id,roleDAU/WAU of Tenant Admins
Clicked_Edit_Org_Details
Click on “Enter/Edit Org Details.”
org_id,user_idClick rate on Org Setup
Completed_Org
Successfully enters and saves organization details.
org_id,completion_time,fields_filledSetup completion
patterns,rate,timeTimeinvestmenttopercompleteClicked_Edit_Utility_Details
Click
task,onbottleneck“Enter/EditidentificationUtility Details.”utility_id,Event:Setup_Help_AccessedProperties:user_id
Click
timestamp,rateadmin_id,onhelp_topic,Utilitycontext_page,SetupCompleted_Utility_Setup
Successfully
time_spent_viewing_helpenters and saves utility details.utility_id,Insights:Commoncompletion_time,confusionfields_filledSetup
points,completioneffectivenessrate, Time to completeViewed_Data_Upload
Opened the Data Upload section.
user_id
Engagement with data upload section
Clicked_Upload_Files
Clicked on "Upload Files" in Data Upload.
user_id,file_count,file_sizeClick rate on Upload Files, Number of
helpfilescontentuploadedDashboardViewed_Subscription_OverviewOpened
UsagetheMetricsEvent:Dashboard_Section_ViewedProperties:timestamp, admin_id, section_name, time_spent_in_sectionInsights:Section popularity, admin focus areas, navigation patterns
Event:Metric_DrilldownProperties:timestamp, admin_id, metric_name, filter_appliedInsights:Detail exploration patterns, metrics of highest interest
Event:Admin_Action_TakenProperties:timestamp, admin_id, action_type, context, resultInsights:Action frequency, success rates, common workflows
Security Response MetricsEvent:Security_Alert_ViewedProperties:timestamp, admin_id, alert_id, alert_severity, time_to_viewInsights:Alert response times, prioritization patterns
Event:Security_Action_TakenProperties:timestamp, admin_id, action_type, related_alert_id, resolution_statusInsights:Resolution effectiveness, common response patterns
Subscription
ManagementOverviewMetricssection.Event:
user_idEngagement
Subscription_Info_ViewedProperties:timestamp, admin_id, plan_details_expanded, time_spent_viewingInsights:Interest inwith subscriptiondetails, potential upgrade indicators
Event:Billing_Info_UpdatedProperties:timestamp, admin_id, fields_changed, successful_updateInsights:Billing information management patterns, error points
These metrics will collectively provide insights into admin behavior patterns, system effectiveness, and opportunities for continuous improvement of the SMART360 System Admin Dashboard.details