CSO Dashboard (CIS01US01)
1. Problem Statement
For Utility Administrator:
- Lack of unified view of all critical utility operations and KPIs across departments
- Inability to quickly identify operational issues requiring immediate attention
- Scattered information across multiple systems making decision-making time-consuming
- Limited visibility into cross-departmental performance correlations
- Difficulty in monitoring real-time operational status and trends
For CSO Manager:
- No centralized view of customer service metrics and complaint resolution status
- Inability to quickly assess service request backlog and resolution performance
- Limited visibility into customer satisfaction trends and service quality metrics
- Difficulty correlating service issues with operational problems
- Lack of real-time alerts for escalating customer service issues
Core Problem:
The current utility management system lacks a unified command center dashboard that provides managers with a comprehensive, real-time view of all critical operations, KPIs, and performance metrics. This results in fragmented decision-making, delayed response to issues, and inability to identify cross-departmental correlations that impact overall utility performance.
2. Who Are the Users Facing the Problem?
Utility Administrator:
- Oversees overall utility operations and strategic decision-making
- Monitors cross-departmental performance and resource allocation
- Ensures regulatory compliance and operational efficiency
- Coordinates emergency response and strategic initiatives
CSO Manager:
- Manages customer service operations and satisfaction metrics
- Oversees complaint resolution and service request fulfillment
- Monitors customer engagement and digital adoption
- Ensures service level agreement compliance
3. Jobs To Be Done
For Utility Administrator:
- When I need to assess overall utility performance and identify critical issues requiring attention, But I must navigate multiple systems and reports to gather comprehensive information, Help me access a unified command center dashboard with real-time KPIs and alert notifications, So that I can make informed strategic decisions quickly and coordinate cross-departmental responses effectively.
For CSO Manager:
- When I need to monitor customer service performance and identify emerging issues, But I lack visibility into real-time service metrics and complaint trends, Help me view integrated customer service dashboards with escalation alerts and resolution tracking, So that I can proactively address service issues and maintain high customer satisfaction levels.
4. Solution
The Command Center Dashboard provides a comprehensive, unified view of all critical utility operations and performance metrics:
Key Capability Areas:
- Executive Summary Analytics
- Real-time KPI cards showing Total Revenue, Service Requests, Collection Rate, and Active Complaints
- Trend indicators with month-over-month percentage changes
- Color-coded status indicators for quick issue identification
- Automated alert notifications for metrics exceeding thresholds
- Revenue Performance Monitoring
- Revenue trend visualization with historical comparison
- Revenue by consumer category breakdown with monthly trends
- Collection rate tracking with payment performance metrics
- Outstanding balance monitoring with aging analysis
- Customer Service Operations
- Service request volume tracking with active/overdue categorization
- Complaint management with resolution rate monitoring
- Service request categorization by type and priority
- First-call resolution tracking and average handling time metrics
- Operational Performance Dashboard
- Service request resolution time analysis by priority levels
- Peak usage time monitoring for resource planning
- Water usage by segment tracking for demand forecasting
- Disconnection tracking with pending and completed status
- Account Management Overview
- Active account summary with growth tracking
- Account health scoring based on payment history
- Customer segmentation analysis (Residential, Commercial, Industrial)
- New account acquisition tracking with conversion metrics
- Digital Adoption Metrics
- Mobile app usage tracking with engagement metrics
- Web portal usage monitoring and feature adoption
- Digital payment adoption rates and transaction volumes
- Self-service utilization tracking to reduce call center load
- Payment Performance Analytics
- On-time payment rate monitoring with trend analysis
- Payment method preference tracking and optimization
- Collection efficiency metrics with aging breakdown
- Digital payment adoption impact on collection rates
- Quick Action Center
- One-click access to common management tasks
- New service request creation with priority assignment
- Payment recording with account reconciliation
- Complaint registration with automatic routing
- Customer addition with service activation
- Connection management with field coordination
- Rate transfer processing with approval workflow
- Disconnection management with customer notification
5. Major Steps Involved
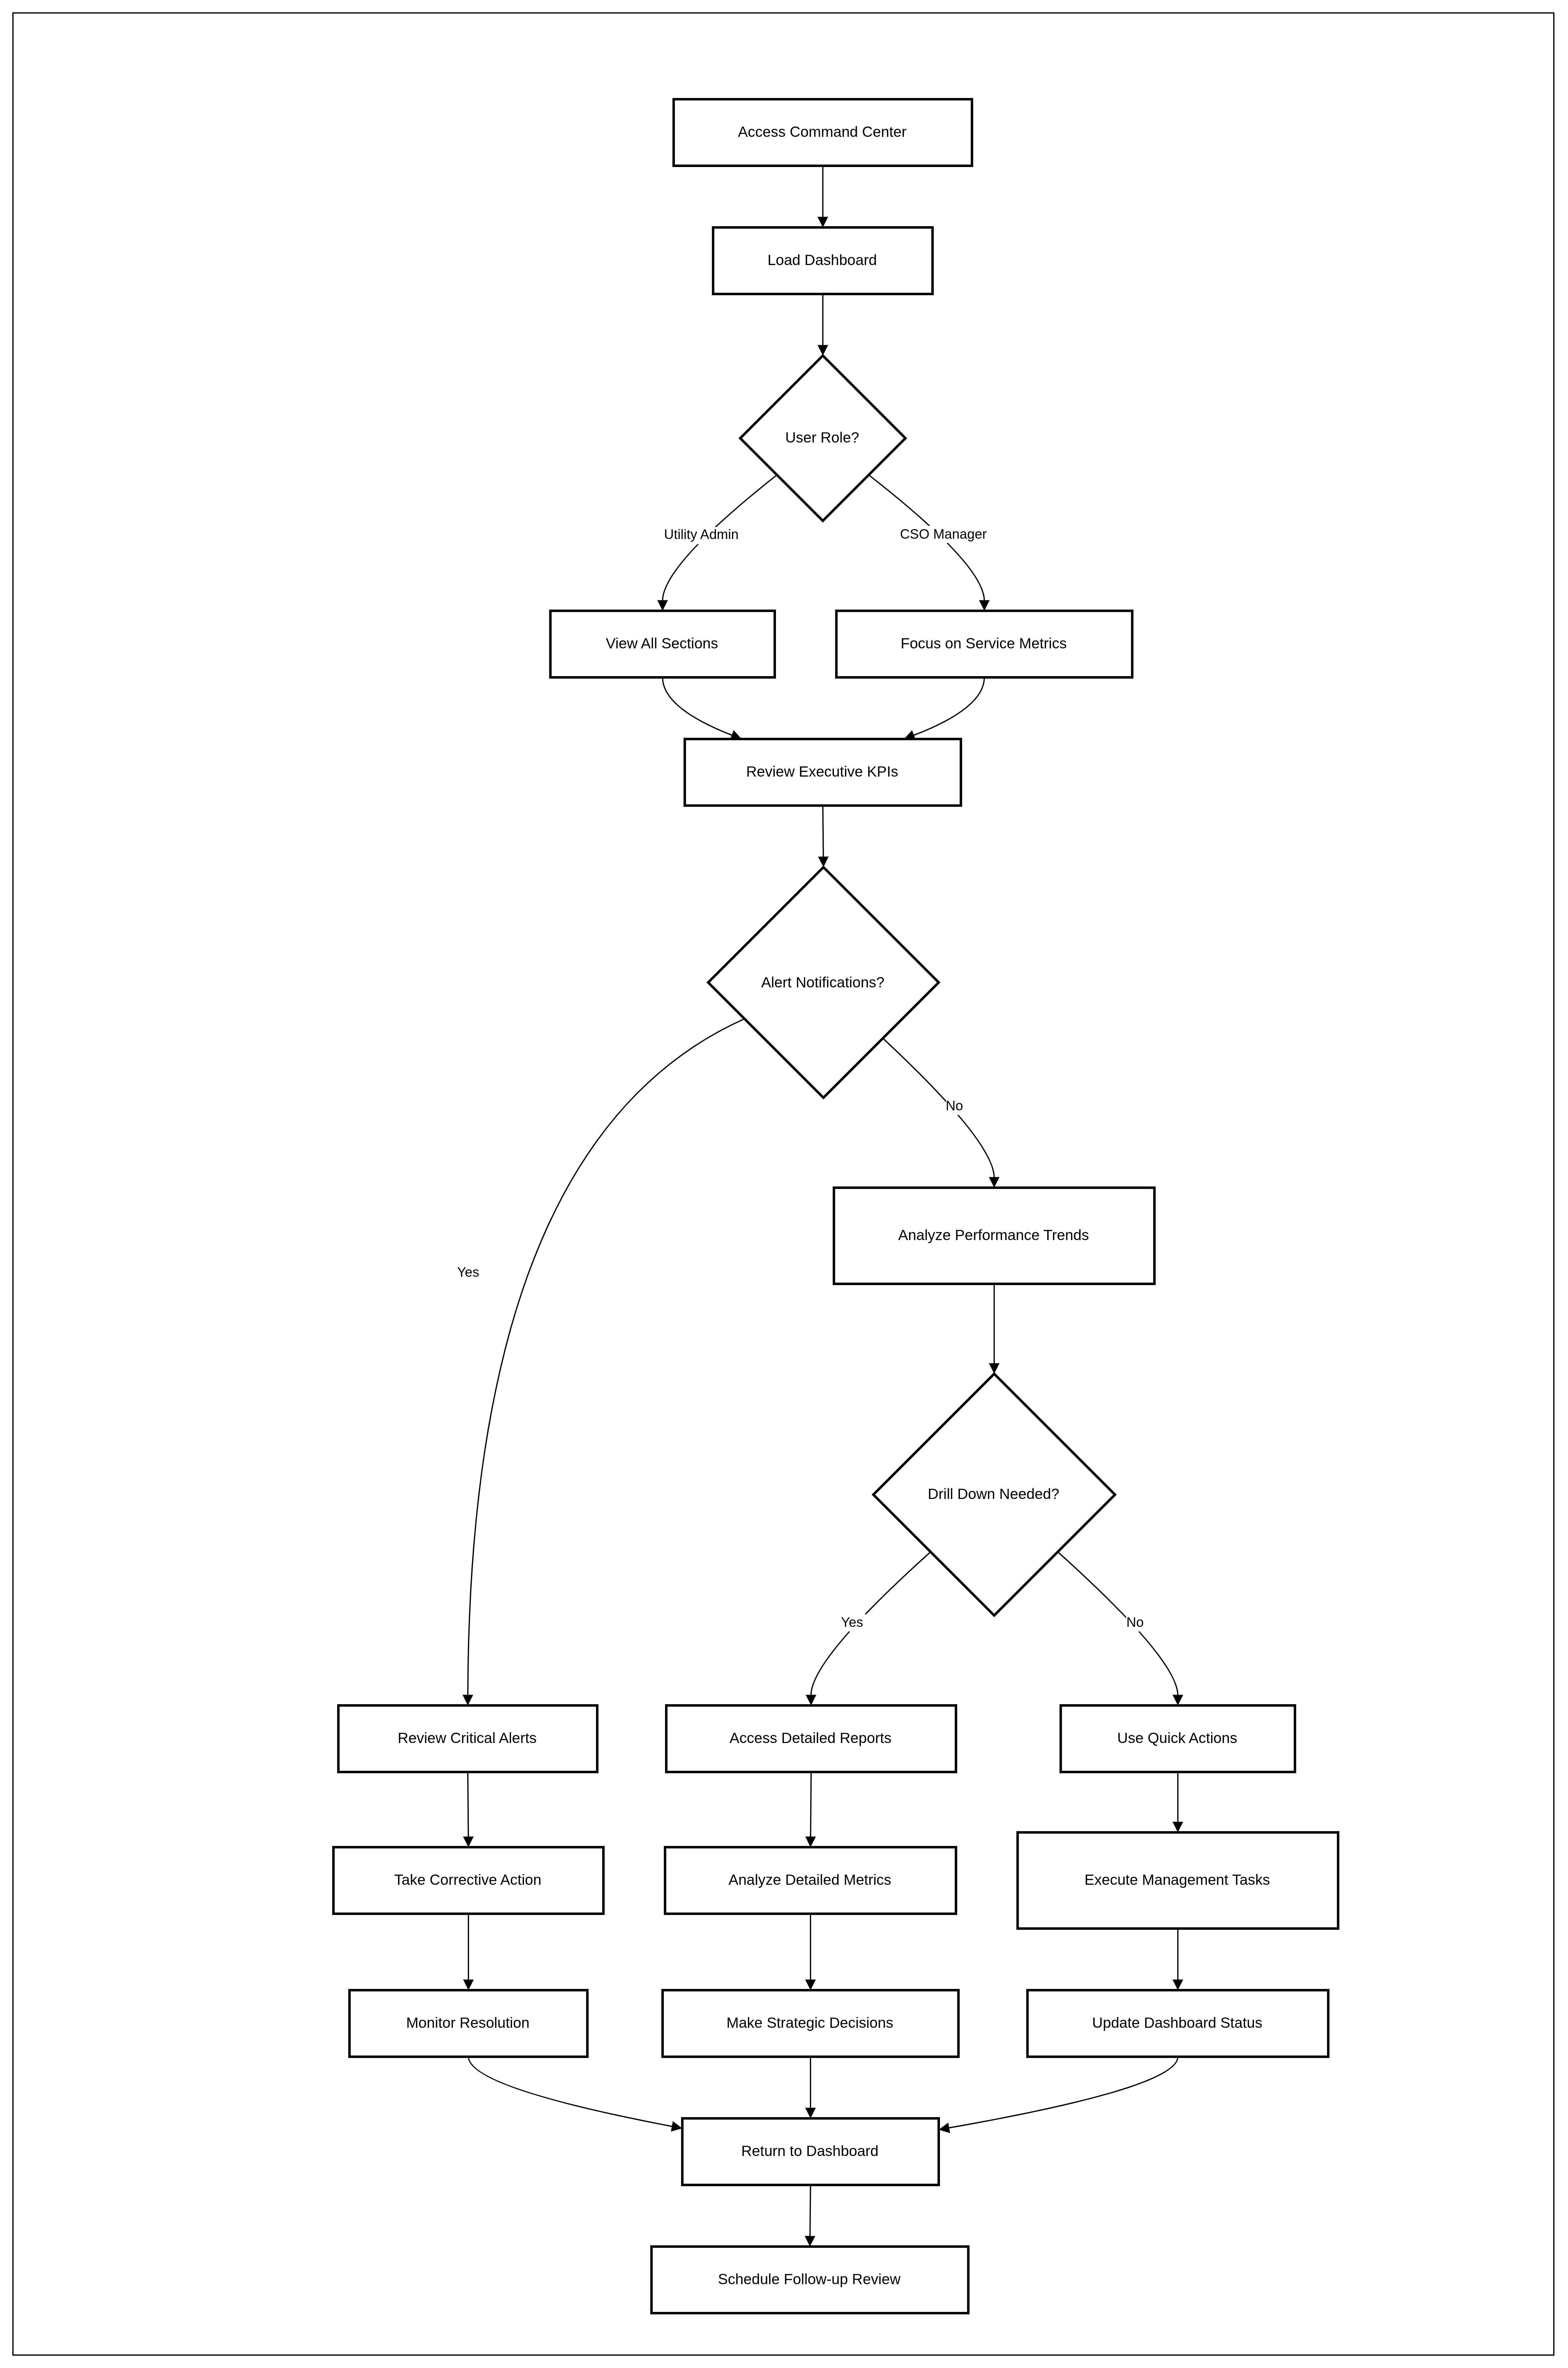
For Utility Administrator using the Command Center Dashboard:
- Access Command Center
- Navigate to SMART360 main navigation menu
- Select "Command Center" from the dashboard options
- System loads unified dashboard with real-time data refresh
- View welcome message with last update timestamp
- Review Executive KPIs
- Scan Analytics & Insights section at top of dashboard
- Review Total Revenue ($298,500) with 12.5% growth indicator
- Check Service Requests (718) with 8.3% increase from last month
- Monitor Collection Rate (82%) with 3.2% improvement
- Assess Active Complaints (24) with 5.8% decrease
- Analyze Revenue Performance
- Review Revenue Trend chart showing 6-month performance
- Analyze Revenue by Consumer Category breakdown
- Identify highest revenue-generating segments
- Compare current month performance against historical trends
- Monitor Customer Service Metrics
- Check Service Requests section showing 48 Active and 5 Overdue
- Review average completion time (4.2 hrs) and first resolution rate (82%)
- Analyze service requests by category (Water Supply, Metering Issues, etc.)
- Monitor complaint resolution with 18 Active and 7 Resolved Today
- Assess Operational Status
- Review Disconnection section with 24 Pending and 12 Completed Today
- Monitor service categories and priority distributions
- Check resolution times by priority level (Urgent, High, Medium, Low)
- Analyze peak usage patterns for resource planning
- Review Account Performance
- Check Consumer Account Summary with 1256 Active Accounts
- Review new account additions (24 new accounts, 2.3% growth)
- Analyze Account Health Score (87% overall health rating)
- Review customer segmentation distribution
- Monitor Digital Adoption
- Check Mobile App Usage (68%) and Web Portal Usage (54%)
- Review digital payment adoption trends
- Analyze self-service utilization impact on call center volume
- Track feature adoption across digital channels
- Utilize Quick Actions
- Access Quick Actions panel for common tasks
- Create new service requests directly from dashboard
- Record payments and update account status
- Register complaints with automatic routing
- Initiate disconnection procedures with proper notifications
For CSO Manager using customer-focused sections:
- Monitor Service Request Performance
- Focus on Service Requests panel with active/overdue breakdown
- Review resolution time metrics by priority level
- Analyze service request categories and trending issues
- Monitor first-call resolution rates and customer satisfaction
- Track Complaint Management
- Review Complaints section with active and resolved counts
- Monitor escalation rates and resolution timeframes
- Analyze complaint categories for pattern identification
- Track customer satisfaction scores post-resolution
6. Flow Diagram
7. Business Rules
General Dashboard Rules:
- Dashboard must refresh data automatically every 5 minutes during business hours
- All monetary values must be displayed in the configured utility currency format
- Percentage changes must be calculated based on the same period in the previous month
- All timestamps must display in the user's local timezone
- Dashboard access requires appropriate role-based permissions
- Critical alerts must be highlighted with visual indicators (red, yellow, green)
- Historical trend data must be available for minimum 12 months
- All dashboard sections must be responsive and accessible on mobile devices
KPI Calculation Rules:
- Total Revenue includes all billed amounts for the current month regardless of payment status
- Service Requests count includes all requests created in the current period regardless of status
- Collection Rate = (Payments Received / Total Amount Due) * 100 for the period
- Active Complaints include all unresolved complaints regardless of creation date
- Month-over-month changes must exclude weekend and holiday variations
- Account Health Score considers payment history, complaint frequency, and service usage patterns
- Resolution times are calculated from request creation to final closure timestamp
- Peak usage analysis must consider seasonal variations and historical patterns
Quick Actions Rules:
- New Service Request creation requires customer account validation
- Payment recording must include payment method and reference number validation
- Complaint registration automatically assigns unique reference numbers
- Customer addition requires address verification and service feasibility check
- Connection requests must validate technical requirements and scheduling availability
- Rate transfers require approval workflow based on account value thresholds
- Disconnection actions require customer notification and compliance verification
- All quick actions must log user identification and timestamp for audit purposes
Analytics & Insights Section Rules:
- Total Revenue field must display current month's total billed amount in currency format ($298,500)
- Total Revenue percentage change must be calculated as ((Current Month - Previous Month) / Previous Month) * 100
- Total Revenue trend indicator must show green arrow up for positive growth, red arrow down for negative
- Service Requests field must count all requests created in current month (718)
- Service Requests percentage must compare current month total to same month previous year
- Service Requests icon must be blue chart symbol indicating operational metrics
- Collection Rate must be calculated as (Payments Received / Total Amount Due) * 100 (82%)
- Collection Rate must display circular progress indicator with color coding: Green >80%, Yellow 60-80%, Red <60%
- Active Complaints must count all unresolved complaints regardless of creation date (24)
- Active Complaints trend must show percentage change from previous month with red warning icon
- All percentage changes must be displayed with + or - prefix and appropriate color coding
- Analytics cards must refresh every 5 minutes during business hours
Revenue Section Chart Rules:
- Revenue Trend chart must display 6-month historical data as line chart
- Revenue Trend X-axis must show month abbreviations (Jan, Feb, Mar, Apr, May, Jun)
- Revenue Trend Y-axis must start from 0 and scale to maximum value + 20% padding
- Revenue Trend line must be blue color (
#007bff) with smooth curve interpolation - Revenue by Consumer Category must display stacked bar chart with 3 categories
- Consumer Category bars must use distinct colors: Blue (Residential), Green (Commercial), Orange (Industrial)
- Consumer Category chart must show monthly data for current 6-month period
- Consumer Category Y-axis must display values in thousands with appropriate scaling
- Both charts must include hover tooltips showing exact values and percentages
- Charts must be interactive with click-through capability to detailed reports
Consumer Account Summary Rules:
- Active Accounts field must count all accounts with status = 'Active' (1256)
- Active Accounts percentage must compare current month to previous month (+2.3%)
- New Accounts field must count accounts created in current month (24)
- New Accounts percentage must show growth rate from previous month (+2.8%)
- Account Health Score must be calculated based on payment history, complaint frequency, service usage
- Account Health Score must display as percentage with color coding: Green >85%, Yellow 70-85%, Red <70%
- Account Segments chart must show horizontal stacked bar with customer type distribution
- Segments must be color-coded: Blue (Residential), Green (Commercial), Purple (Industrial), Gray (Other)
- Segment percentages must total 100% and display customer count on hover
- All account metrics must update in real-time when new accounts are created or modified
Key Metrics Scorecard Rules:
- Revenue Collection percentage must be calculated as (Collected Amount / Billed Amount) * 100 (92.3%)
- Revenue Collection change indicator must show month-over-month comparison (+1.7%)
- Outstanding Balance must display total unpaid amount in currency format ($183.5K)
- Outstanding Balance change must show percentage variance from previous month (-4.2%)
- Mobile App Usage must calculate unique active users / total registered users * 100 (68%)
- Mobile App Usage change must compare current month to previous month (+5.3%)
- Web Portal Usage must calculate unique portal sessions / total customers * 100 (54%)
- Web Portal Usage change must show monthly growth rate (+3.8%)
- All scorecard metrics must display with appropriate icons and color coding
- Percentage changes must update daily based on rolling 30-day calculations
Payment Performance Section Rules:
- Total Payments must display sum of all payments received in current month ($45,231)
- Total Payments percentage must compare current month to previous month (+14.2%)
- Outstanding Amount must show total unpaid balances across all accounts ($12,450)
- Outstanding Amount change must indicate improvement (negative) or deterioration (positive) (-0.5%)
- On-Time Payment Rate must calculate payments made by due date / total payments * 100 (82%)
- Digital Payment Adoption must calculate digital payments / total payments * 100 (65%)
- Aging Breakdown chart must display horizontal stacked bars with 4 categories
- Aging categories must be: Current (0-30 days), 30 Days (31-60), 60 Days (61-90), 90+ Days (>90)
- Aging bars must use color gradient: Green (Current) to Red (90+ Days)
- Payment metrics must update in real-time when payments are processed
Service Requests Section Rules:
- Active Requests must count all requests with status = 'Open' or 'In Progress' (48)
- Overdue requests must count active requests where current_date > due_date (5)
- Average Completion time must calculate mean resolution time for completed requests (4.2 hrs)
- First Resolution rate must calculate resolved on first attempt / total completed * 100 (82%)
- Service request categories must display horizontal bar chart with request counts
- Category bars must show: Water Supply (18), Metering Issues (12), Connection Requests (10), Maintenance (8)
- Category chart must use consistent color coding across all service request visualizations
- Severity distribution must show requests by priority: High, Medium, Low with color coding
- Service request metrics must update every 15 minutes from field management system
- Overdue requests must trigger alerts when count exceeds 10% of active requests
Complaints Section Rules:
- Active Complaints must count all complaints with status ≠ 'Resolved' (18)
- Resolved Today must count complaints closed on current date (7)
- Escalation Rate must calculate escalated complaints / total complaints * 100 (15%)
- Resolution Rate must calculate resolved complaints / total complaints * 100 (83%)
- Top Categories chart must display complaint types with highest volume
- Category bars must show: Water Quality (8), Billing Issue (6), Service Delay (4), Infrastructure (2)
- Severity breakdown must categorize complaints: Critical, High, Medium, Low
- Complaint severity must be color-coded: Red (Critical), Orange (High), Yellow (Medium), Green (Low)
- Resolution rate must trigger alerts if below 75%
- Complaint metrics must integrate with customer service ticketing system
Disconnection Section Rules:
- Pending disconnections must count requests with status = 'Pending' (24)
- Completed Today must count disconnections executed on current date (12)
- Service Interruptions must count unplanned service disruptions (8)
- Average Process Time must calculate mean time from request to completion (3.2 days)
- Disconnection reasons must categorize: Non-Payment, Violation, Maintenance
- Reason distribution must show horizontal bars with counts per category
- Status tracking must show: Pending, Scheduled, In Progress, Completed
- Status bars must use color progression: Gray (Pending) to Green (Completed)
- Pending disconnections must trigger alerts for regulatory compliance timeframes
- Disconnection metrics must integrate with field operations scheduling system
Service Requests Chart Rules:
- Monthly service requests chart must display dual-bar visualization (green and orange bars)
- Green bars must represent completed service requests for each month
- Orange bars must represent pending/active service requests for each month
- Chart must display 6-month trend from January to June
- Y-axis must scale from 0 to maximum value with 20% padding (0-160 range)
- X-axis must show month abbreviations with consistent spacing
- Bars must include data labels showing exact counts on hover
- Chart must allow drill-down to detailed service request reports by month
Resolution Time Chart Rules:
- Resolution time chart must categorize by priority levels: Urgent, High, Medium, Low
- Purple bars must show average resolution time in hours for each priority
- Chart must use ascending order from Urgent (shortest) to Low (longest) priority
- Y-axis must display time scale from 0 to maximum + 25% (0-28 hours range)
- Priority color coding must be consistent: Red (Urgent), Orange (High), Yellow (Medium), Blue (Low)
- Resolution times must be calculated from request creation to closure timestamp
- Chart must update daily based on completed requests from previous 30 days
- Hover tooltips must show exact time values and request counts per priority
Water Usage Charts Rules:
- Utility selector dropdown must default to "Water" with options for Electricity, Gas
- Water Usage by Segment chart must display monthly consumption by customer type
- Segment bars must be color-coded: Blue (Residential), Purple (Commercial), Orange (Industrial)
- Usage chart must show 3-month rolling data (Jan, Feb, Mar)
- Y-axis must display consumption units (0-3000 range) with appropriate scaling
- Peak Usage Times chart must display hourly consumption pattern as line chart
- Peak usage X-axis must show time periods from 6 AM to 9 PM in 3-hour intervals
- Peak usage Y-axis must show consumption percentage (0-100% range)
- Peak usage line must be blue with circular data points for each time interval
- Usage data must update daily from meter reading systems
- Peak usage analysis must consider seasonal variations and historical averages
- Charts must be interactive with click-through to detailed consumption reports
Quick Actions Section Rules:
- New Service Request button redirects to services page
- Record Payment button redirects to payments page
- Register Complaint button redirects to complaints page
- New Connection button redirects to consumer onboarding page
- transfer button must redirects to transfer page
- Disconnection button must redirect to disconnection page
8. Sample Data
Executive KPIs:
- Total Revenue: $298,500 (↑ 12.5% from last month)
- Service Requests: 718 (↑ 8.3% from last month)
- Collection Rate: 82% (↑ 3.2% from last month)
- Active Complaints: 24 (↓ 5.8% from last month)
Revenue Performance:
- Monthly Revenue Trend: Jan ($45,000), Feb ($42,000), Mar ($48,000), Apr ($47,000), May ($52,000), Jun ($58,000)
- Revenue by Category: Residential ($28,000), Commercial ($18,000), Industrial ($12,000)
Customer Account Summary:
- Active Accounts: 1,256 (↑ 2.3%)
- New Accounts: 24 (↑ 2.8%)
- Account Health Score: 87%
- Customer Segments: Residential (70%), Commercial (20%), Industrial (10%)
Service Operations:
- Active Service Requests: 48
- Overdue Requests: 5
- Average Completion Time: 4.2 hours
- First Resolution Rate: 82%
- Service Categories: Water Supply (18), Metering Issues (12), Connection Requests (10), Maintenance (8)
Complaint Management:
- Active Complaints: 18
- Resolved Today: 7
- Escalation Rate: 15%
- Resolution Rate: 83%
- Top Categories: Water Quality (8), Billing Issues (6), Service Delay (4)
Payment Performance:
- Total Payments: $45,231 (↑ 14.2%)
- Outstanding Amount: $12,450 (↓ 0.5%)
- On-Time Payment Rate: 82%
- Digital Payment Adoption: 65%
- Payment Aging: Current (60%), 30 Days (25%), 60 Days (10%), 90+ Days (5%)
Digital Adoption:
- Mobile App Usage: 68% (↑ 5.3%)
- Web Portal Usage: 54% (↑ 3.8%)
- Self-Service Transactions: 1,247
- Digital Payment Transactions: 892
Operational Metrics:
- Disconnections Pending: 24
- Disconnections Completed Today: 12
- Service Response Time: Average 8 hours
- Peak Usage Time: 6 PM (95% of capacity)
- Water Usage by Segment: Residential (2,850 units), Commercial (1,320 units), Industrial (780 units)
9. Acceptance Criteria
- The system must display a unified command center dashboard accessible to authorized users
- The system must show real-time KPIs for Total Revenue, Service Requests, Collection Rate, and Active Complaints
- The system must display percentage change indicators comparing current month to previous month
- The system must provide visual trend charts for revenue performance over 6-month periods
- The system must show revenue breakdown by consumer category with monthly comparisons
- The system must display active and overdue service request counts with resolution metrics
- The system must show complaint tracking with active and resolved counts
- The system must provide service request categorization by type and priority levels
- The system must display account summary with active accounts and growth metrics
- The system must show account health scoring with overall percentage rating
- The system must provide customer segmentation analysis with distribution percentages
- The system must display payment performance metrics including on-time rates and outstanding balances
- The system must show digital adoption metrics for mobile app and web portal usage
- The system must provide disconnection tracking with pending and completed status
- The system must include quick action buttons for common management tasks
10. Process Changes
Current Process | New Process | Impact |
|---|---|---|
Manual compilation of KPIs from multiple systems requiring 2-3 hours daily | Real-time unified dashboard with automatic data refresh every 5 minutes | 95% reduction in management reporting time with 100% data accuracy |
Separate departmental meetings to review performance metrics | Unified command center enabling cross-departmental visibility | 60% reduction in coordination meetings with improved decision-making speed |
Reactive issue identification through manual report review | Proactive alert system with threshold-based notifications | 80% improvement in issue response time with preventive action capability |
Weekly revenue and collection analysis through manual report generation | Real-time revenue monitoring with trend analysis and forecasting | Daily revenue optimization opportunities identified, improving collection rate by 15% |
Fragmented customer service metrics requiring system switching | Integrated customer service dashboard with complete visibility | 70% improvement in service request resolution time through better resource allocation |
Monthly operational performance reviews with historical data analysis | Real-time operational monitoring with predictive analytics | 50% improvement in operational efficiency through proactive maintenance scheduling |
Manual correlation of cross-departmental performance impacts | Automated correlation analysis with visual performance indicators | Identification of 90% more optimization opportunities through integrated analytics |
Time-consuming executive reporting preparation requiring multiple data sources | One-click executive reporting with real-time data export capabilities | 85% reduction in report preparation time with enhanced accuracy and timeliness |
11. Impact from Solving This Problem
Metric | Improvement Impact |
|---|---|
Management Decision Speed | 3x faster decision-making through real-time unified visibility |
Operational Efficiency | 40% improvement in cross-departmental coordination and resource allocation |
Issue Response Time | 80% reduction in critical issue identification and response initiation |
Revenue Collection Rate | 15% improvement through proactive collection management and digital adoption |
Customer Satisfaction | 25% increase through improved service request resolution and complaint handling |
Data Accuracy | 99.5% accuracy through automated real-time data integration (vs 85% manual compilation) |
Management Reporting Time | 95% reduction in time spent on performance data compilation and analysis |
Strategic Planning Effectiveness | 60% improvement in strategic initiative success rate through data-driven insights |
Emergency Response Coordination | 70% faster emergency response coordination through unified operational visibility |
Regulatory Compliance | 100% compliance maintenance through automated audit trail and alert systems |
Staff Productivity | 35% improvement in management staff productivity through streamlined information access |
Cost Savings | $150,000 annual savings through reduced manual reporting and improved operational efficiency |
12. User Behavior Tracking
Event | Properties | Metrics | Insights |
|---|---|---|---|
Dashboard_Access | user_id, user_role, access_time, device_type | Daily active users, Session duration, Access frequency by role | Which managers are using the dashboard most actively? What are peak usage times? |
KPI_Review | kpi_name, review_duration, user_role, drill_down_action | KPI engagement time, Most reviewed metrics, Role-based preferences | Which KPIs require the most management attention? What drives drill-down behavior? |
Alert_Response | alert_type, response_time, action_taken, user_id | Alert effectiveness, Response time by type, Action completion rate | How quickly are critical issues being addressed? Which alerts drive immediate action? |
Quick_Action_Usage | action_type, completion_status, user_role, execution_time | Action frequency, Success rate, Most used actions by role | Which quick actions provide the most value? What workflow optimizations are needed? |
Drill_Down_Navigation | source_metric, target_report, navigation_path, session_duration | Navigation patterns, Report popularity, User journey analysis | What detailed information do managers seek most? How can navigation be optimized? |
Export_Activity | export_type, data_range, user_role, file_format | Export frequency, Data usage patterns, Format preferences | What data is being shared externally? How is dashboard data being utilized for reporting? |
Threshold_Alert_Trigger | metric_name, threshold_value, alert_frequency, user_response | Alert accuracy, False positive rate, Response effectiveness | Are alert thresholds appropriately set? Which metrics require threshold adjustment? |
Mobile_Access | device_type, location, feature_usage, session_quality | Mobile adoption, Location-based usage, Feature accessibility | How effectively is the mobile dashboard being utilized? What mobile-specific optimizations are needed? |
Cross_Department_Correlation | metric_combination, correlation_strength, insight_generation | Pattern recognition, Cross-functional insights, Decision impact | What operational correlations are managers discovering? How does integrated visibility improve decisions? |
Performance_Benchmark | metric_comparison, time_period, benchmark_type, variance_analysis | Performance tracking, Improvement trends, Goal achievement | How is utility performance trending against targets? What areas need strategic focus? |
Emergency_Response | incident_type, response_time, coordination_effectiveness, resolution_duration | Emergency efficiency, Response coordination, Resolution speed | How effectively does the dashboard support emergency management? What improvements are needed for crisis response? |
Stakeholder_Sharing | shared_metric, recipient_role, sharing_frequency, engagement_level | Information sharing patterns, Stakeholder engagement, Communication effectiveness | How is dashboard information being shared with stakeholders? What metrics drive external communication? |
Questions answered by tracking:
- Which dashboard sections provide the highest value for different management roles?
- How does unified visibility impact cross-departmental collaboration and decision-making?
- What operational patterns and correlations are discovered through integrated analytics?
- How effectively does the dashboard support proactive vs reactive management approaches?
- What is the impact of real-time visibility on emergency response and crisis management?
- Which KPIs drive the most management action and strategic decision-making?
- How does mobile dashboard access enhance field-based management capabilities?
- What dashboard features most effectively support regulatory compliance and audit requirements?
- How does automated alerting improve issue resolution speed and operational efficiency?
- What opportunities exist for further dashboard optimization based on usage patterns?
13. Wirerame
https://preview--utility-compass-flow-13.lovable.app/
No Comments