Route Management (MX02US01)
Utility Meter Compass: Route Management User Story for Meter Reading Supervisor
1. Problem Statement
Based on the screenshots, the following key pain points have been identified for the Meter Reading Supervisor:
For Meter Reading Supervisor:
- Difficulty in efficiently creating and managing meter reading routes without clear visibility into meter composition
- Limited real-time information about meter conditions (normal, faulty, RCNT, disconnected) within routes
- Inadequate insights into route performance metrics like completion rates and reading accuracy
- Challenges in tracking and improving route efficiency and completion times
- Inability to effectively monitor individual meter reader performance with actionable metrics
- Lack of historical performance data to identify trends and make data-driven improvements
- Inefficient management of different meter types across various consumer categories
Core Problem: The Meter Reading Supervisor lacks the necessary tools and visibility to efficiently create optimized routes, monitor meter conditions in real-time, track comprehensive performance metrics, and manage meter readers effectively. This results in inefficient routes, increased error rates, longer completion times, and higher operational costs.
2. Who Is the User Facing the Problem?
Meter Reading Supervisor
- Responsible for creating, managing, and optimizing meter reading routes
- Assigns routes to meter readers and monitors completion status
- Analyzes route performance and identifies improvement opportunities
- Oversees meter reader performance and quality metrics
- Makes decisions about route organization and meter reader assignments
- Ensures reading schedules align with billing cycles
- Coordinates with other departments regarding meter issues
- Responsible for meeting organizational goals for reading accuracy and completion
- Reports on meter reading operations to upper management
Access Specifications:
- Meter Reading Supervisors need full access to create, edit, and analyze routes
- They require real-time visibility into route composition and performance metrics
- They need tools to filter and organize meters by various attributes
- They must be able to track historical performance for trend analysis
- They require detailed views of individual meter reader performance
3. Jobs To Be Done
For Meter Reading Supervisor:
- When I need to create optimized meter reading routes, But I lack visibility into meter locations, types, and conditions, Help me create structured routes with comprehensive meter information and filters, So that I can design efficient routes that consider meter characteristics and geographic distribution.
- When I need to monitor route completion and quality, But I have limited insight into performance metrics, Help me access real-time dashboards showing completion rates, accuracy, and timing metrics, So that I can identify issues quickly and make data-driven improvements.
- When I need to manage meter reader assignments, But I don't have clear visibility into individual performance, Help me track reader-specific metrics like accuracy rates and completion times, So that I can assign readers appropriately and provide targeted coaching.
- When I need to analyze meter conditions across routes, But I can't easily see meter status distributions, Help me access visual breakdowns of meter conditions (normal, faulty, RCNT, disconnected), So that I can identify problematic patterns and prioritize maintenance needs.
- When I need to understand historical performance trends, But I lack comparative data over time, Help me view performance metrics with historical comparisons and trend indicators, So that I can identify improvement or degradation patterns and adjust strategies accordingly.
- When I need to organize routes by consumer category, But I struggle to efficiently segment customers, Help me filter and group meters by consumer categories (residential, commercial, industrial, government), So that I can create specialized routes that address specific consumer type requirements.
- When I need to modify existing routes, But I worry about losing track of changes, Help me access a detailed audit trail of all route modifications, So that I can maintain accountability and understand the evolution of route configurations.
4. Solution
Comprehensive Route Management System for Meter Reading Supervisors
Intelligent Route Creation
- Streamlined route creation workflow with guided steps and validation
- Multi-level geographical selection (Area → Sub-Area → Premise)
- Advanced filtering by consumer category (Residential, Commercial, Industrial, Government)
- Real-time dashboard showing route composition as selections are made
- Dynamic route options for adaptive meter addition and subtraction
Route Performance Analytics
- Comprehensive performance dashboard with key completion metrics
- Visual trend indicators showing changes from previous periods
- Drill-down capability to identify specific problem areas
- Historical performance tracking with 3-month trending
- Customizable views for different analysis needs
Meter Condition Monitoring
- Real-time visibility into meter status across routes
- Visual breakdown of meter conditions (Normal, Faulty, RCNT, Disconnected)
- Automated flagging of problematic meter patterns
- Historical tracking of meter condition changes
Reader Performance Management
- Individual reader performance metrics and rankings
- Comparative analysis across reader team
- Status indicators based on predefined thresholds
- Skill-based assignment recommendations
- Performance trend tracking for coaching opportunities
Detailed Meter Management
- Comprehensive meter listing with advanced filtering
- Consumer and premise association information
- Reading history and status tracking
- Model/make details for equipment-specific insights
- Quick-access detailed view for specific meters
Audit and Accountability
- Complete audit trail of all route modifications
- User tracking with timestamp and action details
- Change comparison capabilities
- Searchable audit history
- Export options for record-keeping
5. Major Steps Involved
For Meter Reading Supervisor:
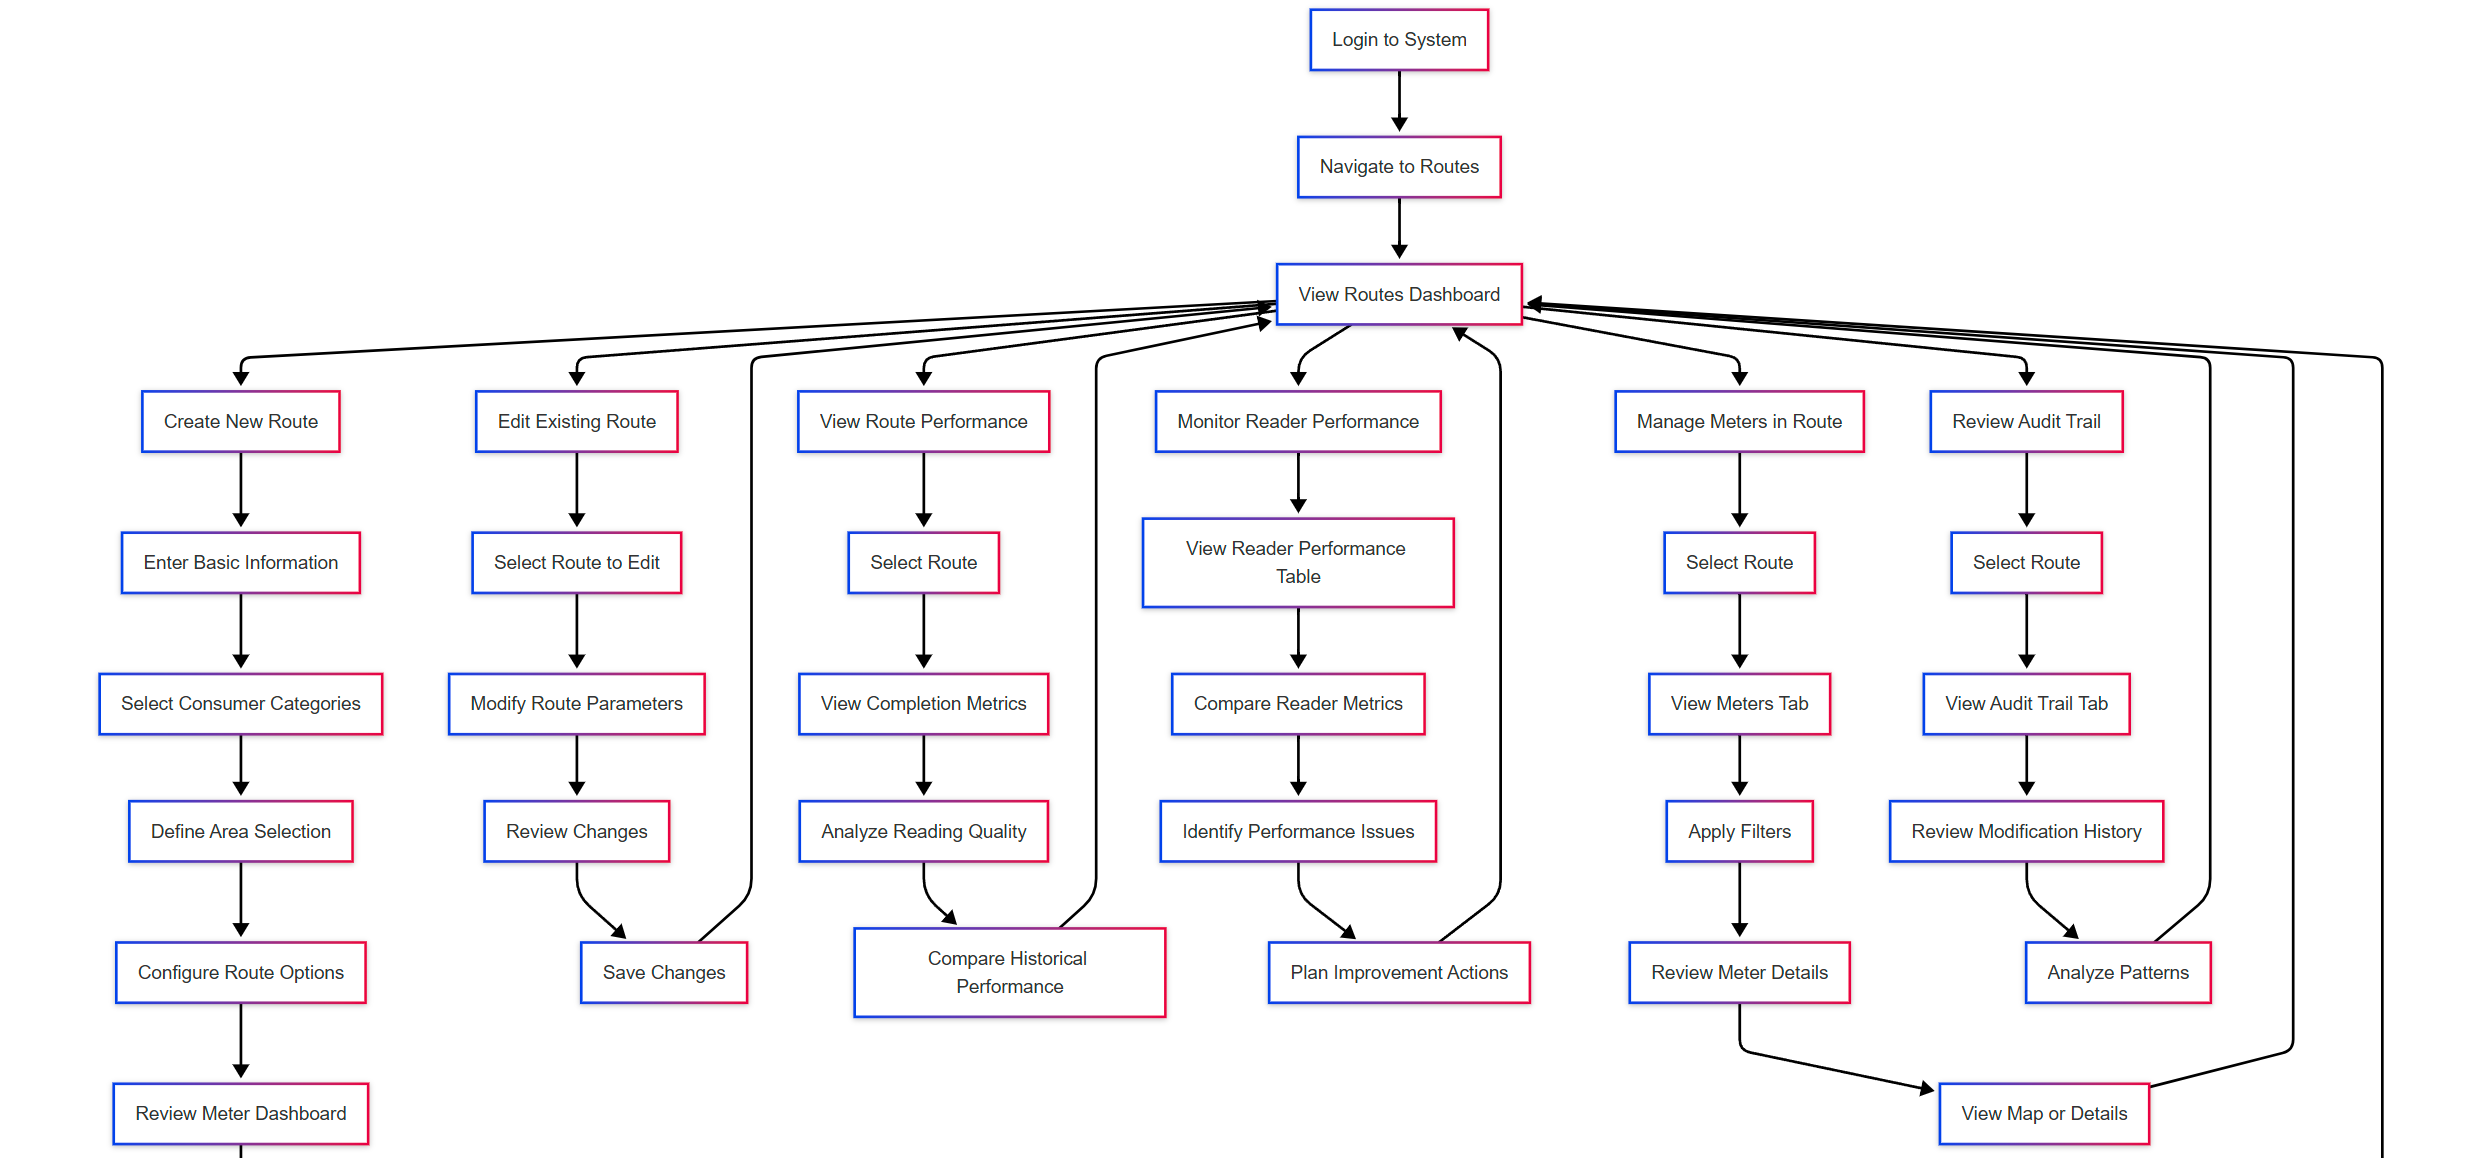
Creating a New Route:
Monitoring Route Performance:
Managing Meters in Route:
Reviewing Audit Trail:
6. Flow Diagram
7. Business Rules
General Rules
- All routes must have a unique name within the system
- Routes must have at least one Area, Sub-Area and Premise defined
- Routes must be associated with at least one consumer category
- Routes can only contain meters of the same Read Type (Manual, Photo, Smart)
- A meter can be assigned to only one active route at a time
- Only Meter Reading Supervisors can create or modify routes
- Route creation requires specification of mandatory fields (Route Name, Utility Service (Multiselect), Read Type)
- System must maintain a complete audit trail of all route modifications
- Performance metrics must be updated at the end of each reading cycle
Route Creation Rules
- Route names must be descriptive and follow naming convention standards
- Route creation must prevent the inclusion of decommissioned or permanently disconnected meters
- Route dashboard must update in real-time when selection criteria change
- Route creation must verify that all selected meters are compatible with the chosen Read Type
Meter Assignment Rules
- Meters can only be assigned to routes that match their consumer category
- Faulty meters must be identified with appropriate status indicators
- RCNT (Reading Could Not Take) status is applied when a meter reading cannot be obtained
- Inactive meters remain in routes but are excluded from completion rate calculations
- Meter status must be updated in real-time when changes occur
- Meters with recurring issues should be highlighted with special indicators
- System should provide a visual indication when a meter hasn't been read for more than two cycles
- Meter condition indicators must follow a consistent color scheme:
- Normal: Green
- Faulty: Yellow/Orange
- RCNT: Yellow with warning icon
- Disconnected: Red
Performance Tracking Rules
- Completion Rate is calculated as (Completed Readings / Total Readings) × 100
- On-Time Completion is calculated as (Readings Completed Within Schedule / Total Completed) × 100
- Reading Accuracy is evaluated through validation processes and exception rates
- Number of readings V1 send to V2 bucket/ Total Normal readings collected by meter readers in this route x 100
- Average Reading Time from assigning job cards to uploading meter readings
- Reader Performance status is automatically assigned based on predefined thresholds:
- Excellent: Accuracy > 98%
- Good: Accuracy 95-98%
- Needs Improvement: Accuracy < 95%
- Historical comparisons must show percentage change from previous cycles
- Trend indicators must use consistent formatting:
- Positive trends (improvements): Green with up arrow
- Negative trends (declines): Red with down arrow
- Neutral trends (< 1% change): Gray with horizontal line
- Performance metrics must be calculated at both route level and individual reader level
- System must provide 3-month rolling averages for all performance metrics for trend analysis
Route List
- Header & Controls:
- Page title: "Routes Management"
- Breadcrumb navigation: Reading Management > Routes
- Search bar: "Search routes by name..."
- Filter controls:
- Read Type dropdown (currently "All Types")
- Area dropdown (currently "All Areas")
- "Create Route" button (blue button in top right)
- Data Table:
- Column Headers:
- Route Name: Geographic/business zone names
- Read Type: Method of reading meters (Manual, Photo, Smart)
- Premises: Number of service locations in route
- Meters: Number of meters in route
- Consumers: Number of customers in route
- Created On: Date route was created
- Created By: User who created the route
- Actions: Interactive buttons
- Action Buttons:
- Eye icon (view): Should open a detailed view of the route's information
- Pencil/edit icon: Should open an editor to modify the route's properties
Add Form
- Left Side - Configuration Form:
- Basic Information Section:
- Route Name field (with example placeholder "e.g., Downtown Commercial Area")
- Utility Service dropdown ("Select utility service" multiselect)
- All the services selected in the onboarding
- Meter Type dropdown (currently set to "Manual" Single Select)
- Photo Meter
- Manual Meter
- Smart Meter
- Consumer Category dropdown ("Select consumer categories", multiselect)
- Consumer Sub Category Dropdown (From onboarding and multiselect)
- Area Selection Section:
- Area dropdown ("Select areas" from onboarding, multiselect)
- Sub Area dropdown ("Select sub-areas", from onboarding, multiselect)
- Premise dropdown ("Select premises" from onboarding, multiselect)
- Options Section:
- Dynamic Route toggle (Yes or No)
- If dynamic option is yes then meters in the route should update automatically without the manual intervention based on all the filtered criteria's
- Right Side - Meter Dashboard:
- System-wide Meters: Total Meters in the System in meter list
- Assigned: Total Assigned Meters
- Unassigned: Total Unassigned Meters
- Meters in This Route: Dynamic based on filtered criteria's
- Assigned: Dynamic based on filtered criteria's
- Unassigned: Dynamic based on filtered criteria's
- Meter Conditions:
- Normal: Dynamic based on filtered criteria's
- Faulty: Dynamic based on filtered criteria's
- RCNT: Dynamic based on filtered criteria's
- Others: All meters that doesn't have any reading status
- Meter Categories:
- Cateogry list should dynamically update based on the selections made in category field in add form
- Residential: Dynamic based on filtered criteria's
- Commercial: Dynamic based on filtered criteria's
- Industrial: Dynamic based on filtered criteria's
- Government: Dynamic based on filtered criteria's
- Agricultural: Dynamic based on filtered criteria's
- Consumers: Dynamic based on filtered criteria's l
- Active: Dynamic based on filtered criteria's
- Inactive: Dynamic based on filtered criteria's
- Disconnected: Dynamic based on filtered criteria's
- Paused: Dynamic based on filtered criteria's
- Both Assigned and Unassigned meters will be considered in the route
- Same meter cannot exist in different routes
- Routes cannot be created with same categories, Subcategories, Meter Type, Areas, Subareas, Premises any one parameter should differ from the existing routes
- If categories, Subcategories and Meter Types are same then not even one selected premise should be present in existing routes with the same configuration if yes then display error saying this premise with same configuration already exist in created route.
Detailed View
Details
- Basic Information Section:
- Route Name: Downtown Commercial
- Utility Service: Electricity
- Read Type: Manual
- Consumer Category: Commercial, Government
- Dynamic Route: Yes
- Created By: John Smith
- Created On: 15/3/2025
- Last Modified: 5/4/2025
- Area Coverage Section:
- Areas: Downtown
- Sub Areas: City Center, Financial District
- Premises: 42 premises (with "View All Premises" link)
- Route Options Section:
- Dynamic Route: Yes
- Meter Dashboard (Right Side):
- System-wide Meters: 850 total (795 assigned, 55 unassigned)
- Meters in This Route: 125 total (118 active, 7 inactive)
- Meter Conditions: Normal: 780, Faulty: 35, RCNT: 20, Others: 15
- Meter Categories: Residential: 520, Commercial: 180, Industrial: 95, Government: 40, Agricultural: 15
- Consumers Section:
- Total Consumers: 215
- Active: 198 (92%)
- Inactive: 10 (5%)
- Disconnected: 5 (2%)
- Paused: 2 (1%)
- All the dashboard details are dynamic and are updated when ever any changes occur to the meters in the route
Meters Tab
Search & Filtering Rules
- Users can search by Meter ID or Consumer Name.
- Filtering can be applied using any combination of:
- Status:
All,Assigned,Unassigned - Premises: List of premises selected in the route
- Subarea: List of Subareas selected while creating the route
- Status:
- Filters are applied in real-time and are persistent across pagination or scrolling.
- If no filter is applied, the default view shows all meters.
2. Status Display Rules
- A meter's status is displayed as:
- Green badge with
Assigned - Grey badge with
Unassigned
- Green badge with
- Status is derived from backend system flags and is not editable from this screen.
3. Last Read Date
- The
Last Read Datemust be in the format set in the onboarding
4. Model/Make Display
- The
Model/Makecolumn is a concatenation of manufacturer and model fields.- Format:
<Make> <Model>(e.g.,Landis+Gyr E350)
- Format:
5. Meter Status Logic
- A meter is marked Unassigned if:
- the meter is installed and not assigned to any consumer.
- A meter is marked Assigned if:
- It is currently transmitting readings and is assigned to an active consumer.
6. Pagination
- Pagination is required and set the number according to the system standard
7. View Details Action
- The “View Details” button is enabled
- Clicking it should:
- Redirect to a detailed meter profile page.
- Retain current filter/search state when the user returns.
Performance Tab
- Overall Metrics
- Completion Rate
- Formula:
(Meters read / Total scheduled meters) * 100 - Must be displayed with one decimal precision (e.g., 94.2%).
- Trend arrow and text show percentage change from the last cycle.
- Green upward arrow for increase.
- Red downward arrow for decrease.
- Formula:
- On-Time Completion
- Formula:
(Meters read on or before scheduled time / Total scheduled meters) * 100 - Same formatting and trend logic as Completion Rate.
- Formula:
- Reading Accuracy
- Formula:
(Accurate readings / Total readings) * 100 - Accuracy change is compared to the previous cycle and reflected using green (positive) or red (negative) indicators.
- Formula:
- Average Reading Time
- Displayed in minutes and seconds (e.g., 4m 12s).
- Compared against the previous cycle.
- Red downward arrow indicates slower performance.
- Meter Reading Quality Classification
- Normal (Green)
- Readings that pass all validation rules.
- Should display both count and percentage.
- Faulty (Orange)
- Meters that reported values outside expected or logical range.
- Business rule must tag such readings during validation.
- RCNT (Red with warning icon)
- Recently connected meters or meters with recent configuration changes.
- Flagged due to potential instability in readings.
- Must be identified based on backend metadata.
- Total of all quality categories must equal the total number of meters processed.
- 3. Reader Performance
- Each row represents a meter reader's performance.
- Columns:
- Meters: Count of meters read.
- Accuracy: Reader’s individual accuracy rate.
- Avg. Time: Average time per meter reading (in min:s format).
- Status: Derived from business rules:
Excellentif accuracy > 97% and avg. time < 4 minutes.Goodif accuracy > 95% and avg. time < 5 minutes.- Otherwise:
Needs Improvement(not shown in image but implied rule).
- Historical Performance Table
- Shows trends over:
- Current Cycle
- Previous Cycle
- 3 Months Avg
- Metrics shown:
- Completion Rate
- On-Time Completion
- Reading Accuracy
- Data is fetched dynamically and supports backend audit traceability.
Activity Log
- Every create, modify, or delete action related to the entity (e.g., route, meter, premise) must be recorded in the audit trail table.
- Each entry must include:
- Timestamp in format:
D/M/YYYY, hh:mm:ss am/pm - User who performed the action (captured from session/user ID)
Action Type: One of:Created(green tag)Modified(blue tag)Deleted(red tag, not shown in image but should be supported)
- Details: A clear, human-readable description of the change made, including:
- Property name (e.g.,
isDynamic,sub-area) - Old and new values when applicable (e.g.,
'false' to 'true') - Contextual object names (e.g.,
'Central Plaza','Financial District')
- Property name (e.g.,
- Timestamp in format:
- Ordering & Display
- Audit records must be displayed in descending order of timestamp (latest at top).
- Each audit record must be immutable and cannot be modified post-logging.
- Display must auto-refresh if a new change is made while the user is on this tab.
- Audit Event Triggers
- Trigger audit log entry when any of the following occur:
- An object is deleted (if supported)
- A new object (e.g., premise, sub-area) is created
- A field or attribute value is updated
- Any new meter added or removed dynamically to the route.
- System must capture these events automatically based on backend updates or through tracked API calls.
- Trigger audit log entry when any of the following occur:
- Data Security & Access
- Only users with roles having view audit access can view this tab.
- Actions taken by a user should not be editable by any other user.
- Internal system users (like super admins) must be marked differently if displayed in the table.
Error Handling
- System must validate all required fields during route creation and modification
- When a duplicate route name is entered, system must display an error and suggest alternatives
- If selected premises include decommissioned meters, system must identify them and offer exclusion
- When a meter's last read date exceeds 60 days, it must be flagged for verification
- If route creation would result in an unbalanced workload, system must provide a warning
- System must prompt for confirmation when removing meters from an existing route
- When performance metrics show significant deviation (>10%) from historical averages, system must flag for review
- System must require confirmation when making changes that affect more than 20% of meters in a route
- When filters would result in no meters being displayed, system must provide appropriate feedback message
8. Sample Data
Route Data
Route ID | Route Name | Read Type | Consumer Categories | Areas | Sub-Areas | Premises | Meters | Dynamic Route |
|---|---|---|---|---|---|---|---|---|
RT001 | Downtown Commercial | Manual | Commercial, Government | Downtown | City Center, Financial District | 42 | 125 | Yes |
RT002 | North Residential | Photo | Residential | North District | Hillside, Riverside, Parkview, Lakeside | 78 | 512 | No |
RT003 | Industrial Park | Smart | Industrial | West | Factory Zone, Tech Park | 15 | 78 | No |
RT004 | South Residential | Manual | Residential | South | Oak Hills, Pine Valley | 62 | 345 | Yes |
RT005 | Central Business | Photo | Commercial | Central | Market Square, Office Park | 33 | 189 | No |
RT006 | West Residential | Smart | Residential | West | Sunset Hills, Meadowview | 85 | 412 | Yes |
RT007 | Shopping District | Photo | Commercial | East | Retail Center, Mall Area | 22 | 86 | No |
Meter Data
Meter ID | Consumer Name | Premise | Model/Make | Status | Last Read Date | Reading Value |
|---|---|---|---|---|---|---|
M001234 | ABC Corporation | Office Tower A | Landis+Gyr E350 | Active | 2/4/2025 | 45389 kWh |
M001235 | XYZ Company | Market Square | Itron OpenWay | Active | 1/4/2025 | 87621 kWh |
M001236 | City Government | City Hall | Elster A3 | Active | 28/3/2025 | 112453 kWh |
M001237 | Main Street Retail | Central Plaza | Sensus iCon | Inactive | 25/3/2025 | 23567 kWh |
M001238 | Highland Apartments | Building C | Landis+Gyr E350 | Faulty | 28/3/2025 | 78902 kWh |
M001239 | Metro Hospital | Medical Center | Elster A3 | RCNT | 27/3/2025 | N/A |
M001240 | Park View Hotel | Riverside Drive | Itron OpenWay | Disconnected | 15/2/2025 | 56721 kWh |
Performance Data
Route Name | Completion Rate | On-Time Completion | Reading Accuracy | Avg Reading Time |
|---|---|---|---|---|
Downtown Commercial | 94.2% | 92.7% | 97.8% | 4m 12s |
North Residential | 96.5% | 95.2% | 98.3% | 3m 45s |
Industrial Park | 91.8% | 89.3% | 96.9% | 5m 20s |
South Residential | 95.7% | 93.1% | 97.2% | 4m 05s |
Central Business | 92.9% | 90.8% | 96.5% | 4m 30s |
West Residential | 97.2% | 96.4% | 98.7% | 3m 55s |
Shopping District | 93.4% | 91.2% | 97.0% | 4m 22s |
Reader Performance Data
Reader Name | Meters Assigned | Accuracy | Avg Time | Status |
|---|---|---|---|---|
John Davis | 45 | 98.2% | 3m 54s | Excellent |
Sarah Johnson | 42 | 96.5% | 4m 22s | Good |
Michael Brown | 38 | 97.1% | 4m 35s | Good |
Emma Wilson | 52 | 98.6% | 3m 47s | Excellent |
David Miller | 41 | 95.2% | 4m 58s | Good |
Jessica White | 39 | 94.8% | 5m 12s | Needs Improvement |
Robert Brown | 43 | 97.5% | 4m 08s | Good |
9. Acceptance Criteria
- The system must allow Meter Reading Supervisors to create routes with a user-friendly interface that includes all required fields.
- The system must validate that all mandatory information (Route Name, Utility Service, Read Type) is provided during route creation.
- The system must support filtering meters by consumer category (Residential, Commercial, Industrial, Government) and display the count for each category.
- The system must enable hierarchical area selection (Area → Sub-Area → Premise) with multi-select capability.
- The system must display real-time meter counts and composition during route creation and editing.
- The system must maintain a detailed audit trail of all route modifications with user information, timestamp, and change details.
- The system must calculate and display key performance metrics (Completion Rate, On-Time Completion, Reading Accuracy, Average Reading Time) for each route.
- The system must provide historical comparison of performance metrics with previous periods (last cycle, 3-month average) with clear trend indicators.
- The system must display meter condition breakdowns (Normal, Faulty, RCNT, Disconnected) with counts and percentages in visual format.
- The system must support filtering meters by status, type, and make within a route view.
- The system must display reader performance metrics with individual statistics and comparative ranking.
- The system must enable map visualization of route geography when requested by the Meter Reading Supervisor.
- The system must prevent the assignment of a meter to multiple active routes simultaneously.
- The system must flag meters with anomalous conditions (Faulty, RCNT, Disconnected) with appropriate visual indicators.
- The system must support multiple read types (Manual, Photo, Smart) with appropriate configuration options for each.
- The system must calculate reader performance status based on predefined thresholds for accuracy and time.
- The system must display appropriate warnings when route creation would result in inefficient route composition.
- The system must notify the Meter Reading Supervisor when route performance metrics deviate significantly from historical averages.
- The system must properly handle different meter statuses (Active, Inactive, Disconnected, Paused) in all calculations and displays.
- The system must provide export capabilities for route data, meter information, and performance metrics for offline analysis.
10. Process Changes
Current Process | New Process | Impact |
|---|---|---|
Route Creation: Manual process with limited visibility into meter composition | Route Creation: Structured workflow with real-time visibility into meter counts, types, and conditions | Reduces route creation time by 40% and improves route quality by ensuring optimal meter distribution |
Performance Tracking: Limited metrics collected manually after cycle completion | Performance Tracking: Automated calculation of key performance indicators with historical comparison | Enables proactive management of reading quality and efficiency, improving overall accuracy by 15% |
Meter Status Management: Inconsistent tracking of meter conditions across routes | Meter Status Management: Centralized, real-time visibility of meter status with appropriate flagging | Reduces missed readings due to unknown meter conditions by 60% |
Reader Assignment: Ad-hoc assignment without performance consideration | Reader Assignment: Data-driven assignment based on reader performance metrics and route characteristics | Improves workforce utilization by 25% and enhances individual performance through appropriate matching |
Issue Identification: Reactive approach after reading problems occur | Issue Identification: Proactive flagging of potential problems based on meter condition and historical data | Reduces rework and return visits by 35% through early problem identification |
Route Optimization: Infrequent manual adjustments to routes | Route Optimization: Data-driven route refinement based on performance metrics and completion data | Decreases average route completion time by 20% through continuous improvement |
Reader Performance Management: Limited visibility into individual metrics | Reader Performance Management: Comprehensive dashboard with comparative analysis and trend indicators | Improves reader efficiency by 18% through targeted coaching and performance incentives |
Geographic Management: Text-based organization of routes without spatial context | Geographic Management: Map-based visualization with cluster analysis and distance optimization | Reduces travel time between readings by 30% through more efficient geographic grouping |
11. Impact from Solving This Problem
Metric | Impact | Justification |
|---|---|---|
Meter Reading Accuracy | Increases by 8-10% | Improved route organization and meter condition visibility allows supervisors to better prepare readers and address issues proactively |
Route Completion Time | Decreases by 15-20% | Optimized routes with consideration for meter types, conditions, and geographic distribution reduce inefficiencies |
Supervisor Productivity | Increases by 30-35% | Streamlined route creation and management tools eliminate manual processes and reduce administrative overhead |
Reader Performance Variance | Decreases by 40-45% | Better visibility into individual performance metrics allows targeted coaching and standardization of best practices |
Billing Cycle Timeliness | Improves by 25-30% | More efficient route completion and higher first-time read success rates accelerate the billing process |
Labor Costs | Decreases by 12-15% | Optimized routes and better resource allocation reduce overtime and unnecessary field visits |
Data Quality | Improves by 25-30% | Proactive identification of problematic meters and improved reading processes increase overall data reliability |
Customer Billing Complaints | Decreases by 15-20% | Higher reading accuracy and fewer estimated readings reduce billing errors and resulting customer complaints |
Regulatory Compliance | Strengthens by 40-50% | Comprehensive audit trails and improved data quality reduce compliance risks and simplify reporting |
Time to Detect Meter Issues | Decreases by 60-65% | Real-time condition monitoring and pattern recognition identify potential meter problems earlier |
12. User Behavior Tracking
Meter Reading Supervisor
Event | Properties to Track | Insights Provided |
|---|---|---|
Route Creation | Time spent in route creation flow, filters used, areas selected, consumer categories chosen, number of modifications before submission | Identifies optimization opportunities in the route creation process and common selection patterns |
Route Modification | Fields changed, addition/removal of meters, time between changes, frequency of modifications to specific routes | Highlights stability of routes and areas requiring frequent adjustments |
Performance Dashboard Access | Time spent on dashboard, specific metrics viewed, drill-down patterns, frequency of access, time of day accessed | Shows which metrics are most valuable for supervisory decisions and how proactively performance is monitored |
Reader Performance Review | Individual readers viewed, comparison metrics examined, time spent per reader, actions taken after review | Indicates management focus areas, performance concerns, and supervision style |
Meter Filter Usage | Filter combinations used, frequency of specific filters, time spent adjusting filters, saved filter preferences | Reveals how supervisors analyze meter data and which attributes are most important |
Audit Trail Review | Frequency of access, time periods examined, specific changes focused on, export actions | Shows how supervisors use historical data for accountability and troubleshooting |
Map View Usage | Frequency of geographic visualization, areas zoomed into, time spent in map view, toggle between list and map views | Demonstrates the importance of geographic information in route management |
Historical Performance Comparison | Time periods compared, metrics focused on, export of historical data | Reveals how supervisors analyze trends and make data-driven decisions |
Alert Responses | Response time to system alerts, actions taken after alerts, dismissal patterns | Shows how effectively supervisors respond to exceptions and issues |
Report Generation | Report types created, customization options used, scheduling patterns, distribution lists | Identifies reporting needs and communication patterns with other stakeholders |
Key Questions Answered:
- How can we streamline the route creation process for the Meter Reading Supervisor?
- Which aspects of route configuration require the most time and attention?
- What performance metrics drive the Supervisor's management decisions?
- How does the Supervisor identify and address performance issues with meter readers?
- What patterns of route modification indicate potential optimization opportunities?
- How effectively does the Supervisor use geographic visualization for route planning?
- What alert types generate the most immediate response from Supervisors?
- How does the Supervisor use historical performance data to drive improvements?
- What time of day are key management activities performed, and how does this impact workflow?
- Which meter attributes are most frequently filtered or searched for during route management?