CSO Manager User Story Document
1. Problem Statement
Core Problem
CSO Managers and Agents face challenges in efficiently tracking service requests, managing billing information, and monitoring performance metrics. Without an optimized dashboard, they struggle to prioritize tasks, track payment status, and maintain visibility on team performance, resulting in delayed service delivery and reduced operational efficiency.
2. Who Are the Users Facing the Problem?
- CSO Manager: Oversees overall service operations, monitors agent performance, and requires high-level metrics to make operational decisions.
- Agents: Handle individual service requests, process customer interactions, and need clarity on assigned tasks and priorities.
3. Jobs To Be Done
For CSO Manager: When I need to monitor overall service performance and agent productivity, But I lack consolidated metrics and status visibility across all service requests, Help me access a comprehensive dashboard with real-time metrics and request tracking, So that I can make informed decisions to improve operational efficiency and service delivery.
For Agents: When I need to prioritize and process service requests efficiently, But I struggle to identify high-priority tasks and track payment statuses, Help me view a clear list of pending service requests with priority indicators and payment information, So that I can focus on critical issues and ensure timely resolution of customer concerns.
4. Solution
A comprehensive dashboard solution that provides real-time visibility into service operations with the following capabilities:
- Dashboard Overview
- Consolidated metrics summary showing key performance indicators
- Visual representation of service request status and completion rates
- Request Management
- Filterable view of ongoing service requests and completions
- Priority-based request sorting and status tracking
- Billing & Payment Tracking
- Real-time visibility of payment statuses across service requests
- Outstanding payment tracking with aging information
- Quality & Efficiency Metrics
- Call abandonment rate tracking with trend analysis
- Avg. pickup time monitoring with comparative analysis
- Escalation rate tracking with trend indicators
- Employee Productivity Metrics
- Cases handled per agent
- Average resolution time
- Resolution rate tracking
- Action Center
- Quick access to common actions like resource allocation
- One-click access to detailed reports
5. Major Steps Involved
For CSO Manager:
- Log into the system and access the Dashboard Overview page
- Review the high-level metrics showing service request count (Complete: 4, Ongoing: 2)
- Check Quality & Efficiency Metrics section to monitor call abandonment rate (9.8%), avg. pickup time (2m 18s), and escalation rate (12.3%)
- Review Employee Productivity metrics including cases per agent (24), avg. resolution time (4.5h), and resolution rate (82%)
- Examine the Ongoing Service Requests & Completions table to see specific request details
- Use the "All Types" filter to narrow down specific service request categories
- Review Agent Performance metrics to monitor team effectiveness
- Use "Schedule Resources" or "Allocate Tasks" buttons to optimize workload distribution
For Agents:
- Access their assigned dashboard view
- Review any assigned ongoing service requests in the table
- Prioritize requests marked as "High" priority
- Process requests based on priority and age (days pending)
- Update request status as they progress
- Track their individual performance metrics
6. Flow Diagram
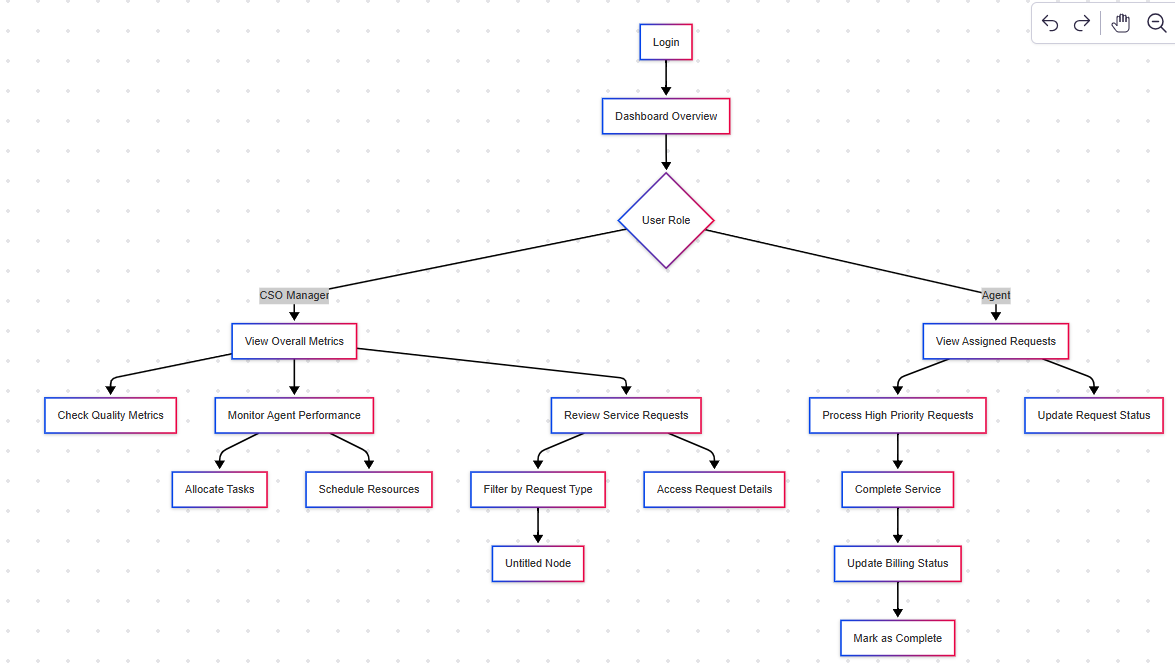
flowchart TD
    A[Login] --> B[Dashboard Overview]
    B --> C{User Role}
    C -->|CSO Manager| D[View Overall Metrics]
    C -->|Agent| E[View Assigned Requests]
    D --> F[Check Quality Metrics]
    D --> G[Monitor Agent Performance]
    D --> H[Review Service Requests]
    E --> I[Process High Priority Requests]
    E --> J[Update Request Status]
    H --> K[Filter by Request Type]
    H --> L[Access Request Details]
    G --> M[Allocate Tasks]
    G --> N[Schedule Resources]
    I --> O[Complete Service]
    O --> P[Update Billing Status]
    P --> Q[Mark as Complete]
7. Business Rules
General Rules
- All service requests must have a priority level assigned (High, Medium, Low)
- Service requests must display current status (Ongoing, Complete)
- Billing information must be tracked for each service request
- Performance metrics must be updated in real-time or with defined refresh intervals
Role-Specific Rules
- CSO Managers have access to all dashboard sections including agent performance metrics
- Agents can only view and access their assigned service requests
- Only CSO Managers can allocate tasks and schedule resources
Validation Rules
- Service requests cannot be marked as complete if payment status is outstanding
- Service requests older than 10 days must be flagged for review
8. Acceptance Criteria
- The system must display a dashboard overview with accurate counts of ongoing and completed service requests.
- The system must provide a filterable view of ongoing service requests with columns for ID, customer, agent, address, progress, and actions.
- The system must clearly indicate priority levels for each service request using color-coding and labels.
- The system must display billing information including amount, payment status, and days outstanding.
- The system must show quality metrics including call abandonment rate, pickup time, and escalation rate with trend indicators.
- The system must present employee productivity metrics including cases per agent, average resolution time, and resolution rate.
- The system must provide action buttons for scheduling resources and allocating tasks.
- The system must allow filtering of service requests by type.
- The system must display the full customer name for each service request.
- The system must provide visual progress indicators for each ongoing service request.
- The system must calculate and display payment aging information for outstanding bills.
- The system must highlight high priority requests to ensure visibility.
- The system must allow users to view all requests with a single click.
- The system must properly format currency values with appropriate symbols.
- The system must display date information in a consistent, user-friendly format.
- The system must provide interactive elements that respond to user actions.
- The system must ensure all data is accurate and synchronized across all dashboard components.
- The system must be accessible and usable on standard desktop devices.
9. Process Changes
Service Request TrackingCurrent
Process:ProcessNew
ServiceProcessImpact
Manual tracking of service requests
are manually trackedacross multiplesystems.New Process:A consolidatedsystemsConsolidated dashboard
provides a unifiedview of all servicerequests.Impact:Reduces time spent searching for information.
Service Request PrioritizationCurrent Process:
No clear priority indication for service
requests.New Process:A color-requestsColor-coded priority system with visual indicators
highlights urgent cases.Impact:Improves focus on critical issues, potentially reducing resolution time for high-priority items.
Payment Status VisibilityCurrent Process:
Limited visibility into payment
status.New Process:Real-time payment tracking with aging
information.Impact:Improves cash flow by highlighting outstanding payments.
Agent Performance TrackingCurrent Process:
Fragmented view of agent
performance.NewperformanceConsolidated
Process:Consolidatedagent performance metricsfor better tracking.Impact:Enables better resource allocation and performance management.
Escalation TrackingCurrent Process:
Manual
tracking of escalations.New Process:Automated monitoring ofescalationratestrackingAutomated escalation rate monitoring with trend
analysis.Impact:Provides early warning of service issues, allowing proactive intervention.
Productivity MetricsCurrent Process:
No standardized productivity metrics
for productivity.New Process:A clearClear display of cases handled, resolution time, and success
rates.Impact:Establishes
abaseline for performance improvement initiatives.QualityScattered
MetricsCurrent Process:Qualityquality metricsare scattered across different sources.New Process:A centralized
Centralized quality dashboard with comparative
analysis.Impact:Facilitates targeted quality improvement efforts.
Resource AllocationCurrent Process:
Manual resource allocation
of workforce resources.New Process:One-click resource scheduling and task
allocation.Impact:Reduces administrative overhead in workforce management.
Current ProcessNew ProcessImpactManual tracking of service requests across multiple systemsConsolidated dashboard view of all service requestsReduces time spent searching for information by approximately 40%No clear priority indication for service requestsColor-coded priority system with visual indicatorsImproves focus on critical issues, potentially reducing resolution time for high-priority items by 30%Limited visibility into payment statusReal-time payment tracking with aging informationImproves cash flow by highlighting outstanding paymentsFragmented view of agent performanceConsolidated agent performance metricsEnables better resource allocation and performance managementManual escalation trackingAutomated escalation rate monitoring with trend analysisProvides early warning of service issues, allowing proactive interventionNo standardized productivity metricsClear display of cases handled, resolution time, and success rateEstablishes baseline for performance improvement initiativesScattered quality metricsCentralized quality dashboard with comparative analysisFacilitates targeted quality improvement effortsManual resource allocationOne-click resource scheduling and task allocationReduces administrative overhead in workforce management10. System Design Details
New Components
- Dashboard Overview Widget: Provides at-a-glance metrics for service operations
- Service Request Tracker: Manages and displays all active and completed service requests
- Billing Integration Module: Connects service requests with payment information
- Agent Performance Tracker: Collects and displays individual and team metrics
- Quality Metrics Engine: Calculates and presents quality-related KPIs
- Task Allocation System: Facilitates resource assignment and scheduling
Integration Points
- API connection between service request system and dashboard
- Data flow from billing system to payment tracking module
- Performance metric collection from agent activity logs
- Quality data aggregation from communication systems
11. Impact from Solving This Problem
Metric
Impact
Justification
Service Request Resolution Time
Reduction in resolution time
Improved prioritization and visibility will enable faster processing of critical issues.
Agent Productivity
Increase in productivity
Clear metrics and better task allocation will optimize agent workflow.
Customer Satisfaction
Improvement in satisfaction
Faster resolution times and better service quality will improve customer experience.
Outstanding Payment Collection
Improvement in collection efficiency
Better visibility of payment status will enable focused collection efforts.
Escalation Rate
Reduction in escalations
Proactive monitoring will allow issues to be addressed before escalation.
Management Efficiency
Improvement in efficiency
Consolidated dashboard eliminates need for multiple system checks and manual reporting.
Resource Utilization
Improvement in resource allocation
Better visibility into agent performance enables optimized scheduling and task allocation.
MetricImpactJustificationService Request Resolution Time30% reductionImproved prioritization and visibility will enable faster processing of critical issuesAgent Productivity20% increaseClear metrics and better task allocation will optimize agent workflowCustomer Satisfaction15% improvementFaster resolution times and better service quality will improve customer experienceOutstanding Payment Collection25% improvementBetter visibility of payment status will enable focused collection effortsEscalation Rate40% reductionProactive monitoring will allow issues to be addressed before escalationManagement Efficiency35% improvementConsolidated dashboard eliminates need for multiple system checks and manual reportingResource Utilization25% improvementBetter visibility into agent performance enables optimized scheduling and task allocationQuestions Answered by Tracking
- How does dashboard usage correlate with team performance improvements?
- Which metrics most strongly predict successful service delivery?
- What patterns exist in high-performing agents' dashboard usage?
- How does prioritization affect overall resolution times?
- What is the relationship between payment visibility and collection rates?
- How does resource allocation impact team productivity metrics?
- Which dashboard features deliver the most operational value?