Printing and Distribution (BX06US01)
1. Problem Statement
For Billing Manager:
- Lack of real-time visibility into printing and distribution status of bills across multiple billing cycles
- Inability to track progress of bills from printing initiation to final delivery to consumers
- Difficulty in identifying delayed billing cycles and proactively escalating issues before deadlines
- Limited oversight of external printing vendor performance and compliance with service level agreements
- Challenges in managing multi-channel distribution (email, SMS, WhatsApp, paper) with unified tracking
- Time-consuming manual processes to coordinate between printing completion and distribution initiation
For Printing Vendor (External Partner):
- Absence of streamlined interface to update printing status and communicate progress back to the utility
- Difficulty in providing accurate completion estimates and managing expectation alignment
- Limited visibility into priority levels and deadline urgency for different billing cycles
- Challenges in documenting delays, issues, or special requirements during the printing process
For System Admin:
- Lack of comprehensive analytics to monitor printing and distribution performance trends
- Difficulty in ensuring data security and access control for external vendor interactions
- Limited ability to configure automated alerts and escalation workflows for delayed cycles
Core Problem:
The current billing system lacks a comprehensive printing and distribution management interface that provides real-time visibility, enables proactive monitoring, and facilitates seamless coordination between internal billing teams and external printing vendors. This results in missed deadlines, poor consumer experience, and inefficient resource allocation across the billing operation.
2. Who Are the Users Facing the Problem?
Billing Manager:
- Oversees the entire billing cycle from meter data import to bill delivery
- Ensures accurate implementation of rate structures and billing rules
- Manages billing exception processes and adjustments
- Develops bill formats and customer communications
- Reports on revenue and billing performance metrics
- Ensures compliance with regulatory requirements for billing
Printing Vendor (External Partner):
- Receives electronic billing files from SMART360 system
- Formats data according to bill template specifications
- Produces physical bills according to quality standards
- Manages insert materials and promotional content
- Ensures timely processing and mailing of statements
- Provides tracking and confirmation of bill production
System Admin (IT Director):
- Oversees all IT infrastructure supporting SMART360 and other utility systems
- Manages cybersecurity protocols and ensures compliance with industry standards
- Monitors system health, performance, and availability metrics
- Reviews and approves vendor invoices for technology services
Utility Administrator:
- Serves as primary SMART360 system administrator for the utility
- Configures system settings to align with utility business processes
- Manages master data including rate structures and service area definitions
- Sets up workflows and approval hierarchies within the system
3. Jobs To Be Done
For Billing Manager:
- When I need to monitor the printing and distribution status of all billing cycles in real-time, But I lack a centralized dashboard with comprehensive visibility across all stages, Help me access a unified dashboard showing printing progress, distribution status, and performance metrics, So that I can proactively identify delays and ensure timely bill delivery to consumers.
- When I need to track individual billing cycle progress from printing to consumer delivery, But I cannot drill down into specific cycle details or consumer-level distribution status, Help me access detailed views showing cycle-specific metrics and consumer-level delivery tracking across all channels, So that I can identify bottlenecks and resolve delivery issues quickly.
- When I need to manage printing vendor performance and ensure compliance with deadlines, But I have limited visibility into vendor progress and no structured way to track delays, Help me monitor vendor performance metrics, lapsed days, and escalation triggers with automated alerts, So that I can ensure service level agreement compliance and maintain billing timeline adherence.
- When I need to coordinate multi-channel bill distribution efficiently, But I struggle to manage and track delivery across email, SMS, WhatsApp, and paper channels simultaneously, Help me access unified distribution management with channel-specific success rates and failure tracking, So that I can optimize delivery methods and ensure maximum customer reach.
For Printing Vendor (External Partner):
- When I need to update printing status and communicate progress to the utility, But I lack direct access to update job status in their system, Help me access a vendor portal or interface to update printing progress, report delays, and communicate completion status, So that I can maintain transparency and enable the utility to track progress in real-time.
- When I need to prioritize printing jobs based on deadlines and urgency, But I cannot see lapsed days or priority indicators in my workflow, Help me access job prioritization information and deadline visibility, So that I can optimize my production schedule and meet critical deadlines first.
For System Admin:
- When I need to ensure secure data exchange between internal systems and external printing vendors, But I lack visibility into data transfer security and access controls, Help me monitor secure file transfers, vendor access patterns, and data protection compliance, So that I can maintain system security while enabling efficient vendor collaboration.
- When I need to track system performance and identify optimization opportunities, But I cannot analyze printing and distribution workflow efficiency, Help me access performance analytics and bottleneck identification tools, So that I can optimize system configurations and improve overall billing operation efficiency.
4. Solution
The Printing & Distribution Management system provides a comprehensive solution for monitoring, tracking, and coordinating bill printing and distribution operations:
Key Capability Areas:
- Printing Dashboard Overview
- Real-time status cards showing pending print start, printing in progress, printed today counts
- Average processing time calculation and delayed print alerts
- Tabbed interface separating printing and distribution views
- Quick access to key performance indicators and trends
- Billing Cycle Management
- Comprehensive table view of all billing cycles with key details
- Status tracking from pending through completion with visual indicators
- Lapsed days calculation and highlighting for overdue cycles
- Print date scheduling and completion date tracking
- Status Update and Workflow Management
- Inline status editing with modal interface for detailed updates
- Status progression workflow (Pending → Started → Completed)
- Vendor assignment and tracking capabilities
- Automated lapsed days calculation based on print date vs current date
- Distribution Channel Management
- Multi-channel distribution tracking (Email, SMS, WhatsApp, Paper, Notification)
- Channel-specific success/failure metrics with detailed counts
- Distribution success rate calculation and monitoring
- Missing contact information identification and resolution
- Consumer-Level Distribution Tracking
- Individual consumer delivery status across all channels
- Comprehensive delivery matrix showing sent/delivered/read/failed status
- Consumer contact information completeness verification
- Failed delivery identification and retry coordination
- Geographic Distribution Management
- Area and sub-area based distribution assignment
- Premises and bill count tracking by geographic zones
- Progress monitoring with visual progress bars
- Bulk assignment capabilities for efficient resource allocation
- Vendor and Resource Assignment
- Flexible assignment options for in-house employees or external services
- Bulk assignment functionality for multiple areas simultaneously
- Courier/postal service name tracking and management
- Optional dispatch date scheduling for coordinated delivery
- Performance Analytics and Reporting
- Success rate calculations and trend analysis
- Delay identification and escalation triggers
- Resource utilization and efficiency metrics
- Vendor performance tracking and SLA compliance monitoring
5. Major Steps Involved
For Billing Manager using the Printing & Distribution Management feature:
- Access Printing Dashboard
- Navigate to the Billing module in SMART360
- Select "Printing & Distribution" from the navigation menu
- View overview dashboard with printing status cards (Pending Print Start: 5, Printing in Progress: 3, Printed Today: 12)
- Review Average Processing Time (2.5 days) and Delayed Print Alerts (2)
- Monitor Billing Cycle Status
- Review billing cycle table showing all active cycles
- Identify cycles with status indicators (Pending, In Progress, Completed)
- Check "Lapsed Days" column to identify overdue cycles (131 days, 105 days, 167 days shown)
- Use search functionality to locate specific billing cycles
- Update Printing Status
- Click the edit icon in the Actions column for a specific cycle
- Modal opens titled "Edit Printing Status" for selected cycle (e.g., January 2025)
- Update Print Date field if needed (currently showing 05 Feb 2025)
- Change Status using button selection (Pending, Started, Completed)
- Update Vendor assignment from "Unassigned" to specific vendor
- Review Lapsed Days calculation (automatically calculated as 131 days)
- Click "Save Changes" to update the record
- Track Distribution Progress
- Click on "Distribution" tab to switch from Printing view
- Review distribution metrics: Pending Dispatch (4), Delivery Failures (12), Distribution Success Rate (95%)
- Monitor Missing Contact Info (8) and Dispatch Delayed (2) alerts
- Review channel-specific distribution data in the billing cycle table
- Analyze Consumer-Level Distribution
- Click on a specific billing cycle to drill down to consumer details
- View consumer distribution summary: Total Consumers (1250), Fully Delivered (1150), At Least One Delivered (1200)
- Review failure metrics: Failed All (50), Missing Contact (25)
- Examine individual consumer records with channel-specific delivery status
- Use channel icons to identify which delivery methods succeeded/failed for each consumer
- Manage Paper Bill Distribution
- Switch to "Paper Bill Distribution" tab
- Review paper distribution dashboard: Total Bills (705), Assigned Bills (325), Successfully Distributed (250)
- Monitor Issues/Pending count (0 in current example)
- Review Areas & Sub-Areas Distribution table showing geographic assignment
- Assign Distribution Resources
- Select unassigned areas using checkboxes in the distribution table
- Click "Bulk Assign (1)" button for selected areas
- In assignment modal, choose Assignment Type: "In-house Employee" or "External Service"
- For external service, enter "Courier/Postal Service Name"
- Set optional "Dispatch Date" using date picker
- Click "Assign" to complete the assignment
- Monitor Performance and Take Action
- Use Sort, Field, Filter, and Export options to analyze data
- Identify cycles with high lapsed days for immediate attention
- Review vendor performance across different billing cycles
- Generate reports for management review and vendor performance evaluation
- Set up alerts for cycles approaching critical deadlines
- Coordinate with External Vendors
- Review vendor assignments and performance in the system
- Monitor external service provider progress and completion rates
- Use the interface to track communication and status updates from vendors
- Escalate issues when vendor performance falls below SLA requirements
For Printing Vendor updating status:
- Access Vendor Interface
- Log into assigned vendor portal section of SMART360
- View assigned billing cycles and current status
- Review priority and lapsed days information for job prioritization
- Update Job Progress
- Select assigned billing cycle requiring status update
- Update status from "Pending" to "Started" when beginning production
- Update to "Completed" when printing job is finished
- Add notes or comments regarding any issues or delays encountered
- Communicate Delays or Issues
- Use status update interface to report any production delays
- Provide estimated completion dates when jobs are behind schedule
- Document any quality issues or special requirements that arise
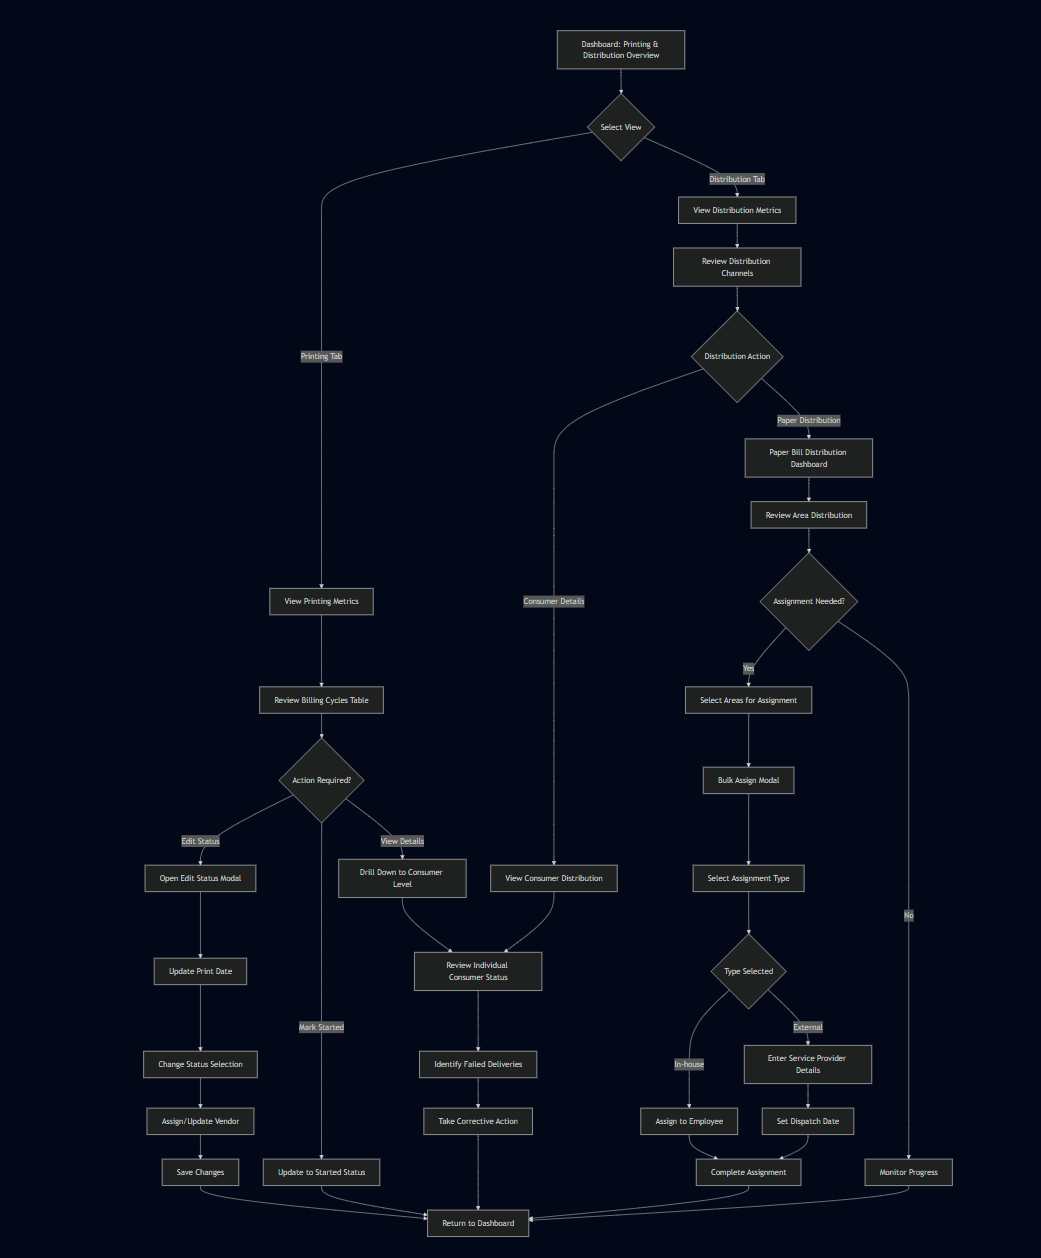
6. Flow Diagram
7. Business Rules
GeneralDashboard Rules:
AllSummarybilling cycles must have a Print Date assigned before printing can be initiatedStatus progression must follow the sequence: Pending → Started → Completed (no backward progression allowed)Lapsed Days calculation is based on current date minus Print Date for all non-completed cyclesOnly users with Billing Manager or System Admin roles can modify printing statusVendor assignments can only be made to pre-approved external partners in the systemAll status changes must be logged with user identification and timestampDistribution cannot begin until printing status is marked as "Completed"
Printing Status Rules:
- Cards
Pending Print
StartStart:count5= Sum- Count of
allbilling cycleswithreadystatusfor"Pending"printing but not yet initiated - Yellow/orange color indicates items waiting for action
- Triggers workflow to begin print job execution
Printing
inInProgressProgress:count3= Sum- Number of
allbilling cycleswithcurrently being printed - Blue color shows active processing status
"Started" - Represents work-in-progress for capacity planning
Printed
TodayToday:count12= Sum- Count of
allbilling cycles completed printing on current date - Green color indicates successful completion
- Daily productivity metric for print operations
Average Processing
TimeTime: 2.5 days- Mean
=durationAveragefromofprint(CompletionstartDateto-completionPrintacrossDate)all jobs - Performance benchmark for
allprintcompletedoperationcycles in current periodefficiency - Used for scheduling and resource allocation planning
Delayed Print
AlertsAlerts:count2- Count of print jobs exceeding expected completion timeframes
- Red color flags urgent attention required
- Exception management for operational issues
Main Data Table Fields
Billing Cycle Name
- January 2025 | February 2025 | December 2024
- Identifies specific billing period for print job
- Links print operations to corresponding billing cycles
Billing Period
- 01/01/2025 - 31/01/2025 | 01/02/2025 - 28/02/2025 | 01/12/2024 - 31/12/2024
- Date range for billing cycle being printed
- Defines scope of customer bills included in print job
Total Bills
- 1250 | 1300 | 1200
- Number of individual customer bills in the print job
- Determines print volume and resource requirements
Print Date
- 05 Feb 2025 | 05 Mar 2025 | 05 Jan 2025
- Scheduled or actual date when printing was initiated
- Critical for tracking print schedule adherence
Completion Date
- "-" (indicates not completed)
- Actual date when printing finished
- Empty values show pending/in-progress status
Status Options
- Pending: Job queued but not started (gray badge)
- In Progress: Currently being printed (blue badge)
- Started: Print job initiated but processing
- Completed: Print job finished successfully
Print By
- Unassigned | Vendor A
- Resource assignment for print job execution
- "Unassigned" = needs resource allocation
- "Vendor A" = specific vendor assigned to job
Lapsed Days
- 131 days | 105 days | 167 days
- Time elapsed since billing cycle completion to current date
- Orange color indicates aging of unprinted bills
- Higher values suggest service delivery delays
Edit Printing Status Modal Fields
Modal Title: "Edit Printing Status"
- Shows which billing cycle is being updated (January 2025)
- Context for status modification
Print Date: 05 Feb 2025
- Editable field showing when printing was scheduled/started
- Can be modified to reschedule print jobs
- Pending
=(currentlyCountselectedofwithcyclesbluewhere Lapsed Days > defined thresholdhighlight) - Started (
appearsavailable option) - Completed (available option)
- Single-select options controlling workflow state
Vendor Dropdown
- Currently shows "Unassigned"
- Selectable field to assign print job to specific vendor
- Controls resource allocation and accountability
Lapsed Days: 131 days
- Read-only calculated field
- Automatically computed based on billing cycle completion date
- Cannot be manually edited
- Cancel: Discards changes and closes modal
- Save Changes: Commits modifications to database
Table Action Icons
- Edit Icon: Opens status modification modal
- Refresh Icon: Updates job status from external systems
- Print Icon: Initiates immediate print job (visible for In Progress items)
- View Icon: Opens detailed print job information
Tip Section
"Prioritize printing cycles with
statusthe"Pending"highest number of lapsed days to minimize delays"- Business rule guidance displayed to users
- Helps optimize print queue management
- Suggests focusing on oldest pending bills first
Search and
LapsedFilterDaysControlsSearch
>Box- Free-text
100) PrintsearchDate cannot be set to a future date beyond currentacross billing cyclerequirementsnames and periodsCompletionEnablesDatequickislocationautomaticallyofsetspecificwhenprintstatusjobs
Sort
changesDropdown- Organizes table data by different field criteria
- Default sorting likely by lapsed days or print date
Field Dropdown
- Selects which columns to
"Completed"display in table view CyclesCustomizeswithdata"Unassigned"presentationvendorbasedcannotonbeusermarkedneeds
- Opens
"Started"advanced filtering options
- Count of
- Downloads table data in various formats
- Enables external reporting and analysis
Based on the Distribution Channeltab Rules:
Emailscreenshot,channelhereformat:areShowsallattempted/deliveredthecountsdynamic(e.g.,fields"950/0/0"and=their950specificattempted, 0 delivered, 0 read)SMS channel format: Shows attempted/delivered counts (e.g., "800/0/0")WhatsApp channel format: Shows attempted/delivered counts (e.g., "650/0/0")Paper channel format: Shows attempted/delivered counts (e.g., "450/0/0")Notification channel format: Shows attempted/delivered counts (e.g., "350/0/0")- functions:
Distribution
SuccessSummaryRateCards= (Total successful deliveries across all channels / Total attempted deliveries) × 100 Pending
DispatchDispatch:count4= Number- Count of billing cycles ready for distribution but not yet dispatched
- Yellow/orange color indicates items awaiting dispatch initiation
- Represents work queued for distribution teams
Delivery
FailuresFailures:count12- Number
= Totalof failed delivery attempts across all distribution channels - Red color flags critical delivery issues requiring attention
- Includes undelivered emails, SMS, physical mail, etc.
Distribution Success Rate: 95%
- Percentage of successful deliveries across all channels
- Green color indicates healthy delivery performance
- Calculated as (successful deliveries ÷ total delivery attempts) × 100
Missing Contact
InfoInfo:count8- Count
=of customer records lacking required contact information - Yellow/orange color indicates data quality issues
- Prevents delivery through digital channels (email, SMS, WhatsApp)
Dispatch Delayed: 2
- Number of
consumersdistributionwithoutjobsvalidexceedingcontactexpectedinformationdispatch timeframes - Red color flags urgent attention for
anydelayedchanneldispatches DispatchExceptionDelayedmanagementcount= Number of cycles where dispatch date has passed butfor distributionnotworkflowcompletedissues
Consumer-Level Distribution Rules:
- Channels Table
- January 2025 | February 2025 | December 2024
- Identifies specific billing period for distribution tracking
- Links distribution operations to corresponding billing cycles
- 01/01/2025 - 31/01/2025 | 01/02/2025 - 28/02/2025 | 01/12/2024 - 31/12/2024
- Date range defining billing cycle scope
- Determines customer bill population for distribution
- 1250
=| 1300 | 1200 - Total number of
consumersbills to be distributed for each cycle - Base number for calculating distribution channel allocations
- February 5th, 2025 | March 5th, 2025 | January 5th, 2025
- Scheduled or actual date when distribution was initiated
- Blue color with calendar icon indicates editable dispatch scheduling
- 950/0/0 | 980/0/0 | 920/700/50
- Format: Delivered/Failed/Pending
- Tracks email delivery success, failures, and queue status
- Blue color represents digital email channel
- 800/0/0 | 820/0/0 | 780/600/40
- Format: Delivered/Failed/Pending
- Monitors SMS delivery performance across customer base
- Green color represents mobile SMS channel
- 650/0/0 | 670/0/0 | 620/550/30
- Format: Delivered/Failed/Pending
- Tracks WhatsApp message delivery status
- Teal color represents WhatsApp messaging channel
- 450/0/0 | 470/0/0 | 420/350/40
- Format: Delivered/Failed/Pending
- Physical mail delivery tracking (print and postal)
- Orange color represents traditional paper delivery
- 350/0/0 | 370/0/0 | 320/250/20
- Format: Delivered/Failed/Pending
- Push notifications or other notification methods
- Purple color represents notification channel
- Pending: Distribution not yet started (gray badge)
- In Progress: Currently distributing bills (blue badge)
- Shows current state of distribution workflow
- "-" (for pending items)
- "3-day delay" (for December 2024)
- Time elapsed since expected dispatch date
- Orange badge indicates delayed distribution requiring attention
- First Number (Delivered): Successfully delivered bills
- Second Number (Failed): Failed delivery attempts
- Third Number (Pending): Bills still in delivery queue
- Email: 920 delivered, 700 failed, 50 pending
- SMS: 780 delivered, 600 failed, 40 pending
- WhatsApp: 620 delivered, 550 failed, 30 pending
- Paper: 420 delivered, 350 failed, 40 pending
- Notification: 320 delivered, 250 failed, 20 pending
- Calendar Icon: Edit dispatch date
- Refresh Icon: Update distribution status
- Download Icon: Export distribution report
- View Icon: Detailed distribution breakdown
- Provides user guidance for distribution management
- Explains how to access detailed consumer-level distribution data
- Mentions ZIP download functionality for bulk distribution files
- Multiple distribution channels operate simultaneously
- Each channel has independent success/failure tracking
- Failed deliveries require retry mechanisms
- Distribution performance is measured across all channels
- Consumer contact information quality impacts delivery success
- Physical dispatch timing affects overall distribution efficiency
- Complete count of customers in the billing cycle
- Base number for distribution calculations and coverage metrics
- Represents entire customer population requiring bill delivery
- Count
=ofConsumersconsumers who received bills through ALL opted channels - Green color indicates successful multi-channel delivery
- Shows customers with complete delivery coverage across all their preferred methods
- Count of consumers who received bills through at least one channel
successfully - Blue color represents partial delivery success
- Includes customers who may have failed delivery on some channels but succeeded on others
- Count of consumers who failed delivery across ALL attempted channels
- Red color flags critical delivery failures requiring immediate attention
- Represents customers who received no bill through any method
- Count of consumers lacking required contact information for delivery
- Orange color indicates data quality issues preventing delivery attempts
- Requires customer data updates before delivery can be attempted
- John Smith | Alice Johnson | Bob Williams | Carol Davis
- Individual customer identification for delivery tracking
- Links to specific customer records and contact information
- CS001 | CS002 | CS003 | CS004
- Unique customer identifier in sequential format
- Primary key for customer account management and delivery tracking
- BN2025010001 | BN2025010002 | BN2025010003 | BN2025010004
- Unique bill identifier with year/sequence format (BN + Year + Sequential)
- Links specific bills to delivery attempts and customer accounts
- $120.50 | $85.75 | $150.25 | $95.00
- Individual customer bill value for current cycle
- Used for revenue tracking and customer account management
- Shows icons for delivery methods each customer has selected
- Email (envelope icon) | SMS (phone icon) | Paper (document icon)
- Defines which delivery methods should be attempted per customer
- Shows icons for channels where delivery was attempted
- Matches opted channels where system initiated delivery process
- Confirms delivery attempts were made according to customer preferences
- Shows
=iconsConsumers who hadfor successful deliveryvia any single channelconfirmations - Subset of sent channels with confirmed successful delivery
- Blue icons indicate successful delivery completion
- Shows icons for channels where customer opened/viewed the bill
- Blue envelope icon indicates email was opened by customer
- Engagement metric showing customer interaction with delivered bills
- Shows
=iconsConsumersfor channels wherealldelivery failed - Bob Williams shows failed SMS and Paper delivery
channels(redfailedhighlighting) MissingIdentifiesContact= Consumers without any valid contact information in the systemConsumerspecific deliverystatusissuesiconsrequiringindicate:retryEmailor(envelope),alternativeSMS (phone), WhatsApp (WhatsApp icon), Paper (document), Notification (bell)methodsDelivery status progression: Sent → Delivered → Read (where applicable)Failed deliveries are marked with "-" in the respective channel columns
Billing Cycle Column
Period Column
Total ConsumersColumn
Dispatch Date Column
Distribution Channel Metrics
Email Column (Blue)
SMS Column (Green)
WhatsApp Column (Teal)
Paper Column (Orange)
Notification Column (Purple)
Status Column
Lapsed Days Column
Channel Delivery Metrics Format
Each channel uses the three-number format:
Example Analysis for December 2024:
Action Icons
Tip Section
"Click a cycle to manage consumer distribution. Use Actions for editing dispatch date or jumping to ZIP download."
Business Rules Implied
Consumer Distribution Summary Cards
Total Consumers: 1250
Fully DeliveredDelivered: 1150
At Least One Delivered: 1200
AtFailed LeastAll: One50
Missing Contact: 25
Consumer List Table Fields
Consumer Name
Consumer ID
Bill Number
Bill Amount
Opted Channels
Sent
Delivered
Read
Failed All
Paper Bill Distribution Rules:
- Summary Cards
Total
BillsBills: 705- Complete
= Sumcount ofallbills requiring physical/paper delivery - Subset of total consumer population who opted for paper delivery
- Base number for paper distribution planning and resource allocation
Assigned
BillsBills: 325= Number- Count of paper bills assigned to delivery personnel or services
- Blue color indicates bills in distribution
personnelworkflow - Shows bills with designated delivery resources
Successfully
DistributedDistributed: 250= Number- Count of paper bills confirmed as delivered to customers
- Green color indicates successful physical delivery completion
- Represents completed distribution transactions
Issues/
PendingPending: 0- Count
=ofBillspaper bills withdistributiondelivery problems orawaitingstillresolutionpending - Gray color shows no current issues (ideal state)
- Would flag bills requiring attention or follow-up
Areas & Sub-Areas Distribution Table
Area Column
- Central District | North Zone | South Zone
- Primary geographic service territories
- Top-level organizational structure for distribution management
Sub-Area Column
- Central-A | Central-B | Central-C | North-A | North-B | South-A
- Secondary geographic subdivisions within each area
- Granular territory assignment for delivery route optimization
Premises
countColumn- 105
is|calculated88as|the87number| 92 | 93 | 75 - Number of
individualphysical locations/addresses in each sub-area - Infrastructure count for delivery planning and resource estimation
Bills
countColumn- 120
represents|the100number| 100 | 105 | 105 | 85 - Number of bills to be
distributeddelivered in each sub-area - Work volume for assignment and capacity planning
Status Options
- Assigned (In-house): Green dot with internal employee assignment
- Assigned (External): Blue dot with external service provider
- Unassigned: Gray dot indicating no delivery resource assigned
Assigned To Column
- John Smith (In-house) | India Post (External) | Alice Johnson (In-house)
- Specific person or service provider responsible for delivery
- Shows resource allocation and accountability assignment
Progress Column
- 45/120 | 100/100 | 105/105
- Format: Completed/Total bills
- Real-time tracking of delivery completion status
- Progress bars show percentage completion (38% | 100% | 100%)
Updated By Column
- Admin User | System Admin | Manager
- User who last modified the assignment or status
- Audit trail for assignment changes and updates
Updated On Column
- 2025-01-15 14:30 | 2025-01-14 16:45 | 2025-01-13 10:20
- Timestamp of last modification
- Tracks recency of assignment updates and activity
Bulk Assign Distribution Modal
Modal Title: "Bulk Assign Distribution"
- Shows number of selected sub-areas (1 selected sub-areas)
- Context for bulk operation scope
Assignment Type Dropdown
- In-house Employee
ProgressExternalpercentageService=- Determines whether assignment goes to internal staff or external vendor
Select Employee Dropdown
- "Choose employee" placeholder
- Populates with available internal staff for assignment
- Only appears when "In-house Employee" is selected
Courier/Postal Service Name Field
- "Enter service provider name" text input
- Free-text field for external service provider identification
- Only appears when "External Service" is selected
Dispatch Date (
DistributedOptional)billsField- Date
/pickerTotalwithbills)"dd-mm-yyyy"×format - Calendar
100icon for date selection - Optional scheduling for future dispatch dates
- Cancel: Discards bulk assignment and closes modal
- Assign: Commits bulk assignment to selected sub-areas
Checkbox Selection System
- Individual checkboxes for each sub-area
Areasmust have valid premise counts before bills can be assignedAssignment can be made to "In-house Employee" or "External Service" onlyExternal service assignments require a "Courier/Postal Service Name"Dispatch Date is optional but recommended for scheduling coordinationrowUpdatedBulkByAssign (0)andUpdated Onfields are automatically populated when assignments are made
- Complete
Area Assignment Rules:
Multiple areas can be selected for bulk assignment using checkboxesBulk assignbutton shows count of selectedareas: "Bulk Assign (n)"itemsAssignmentEnablesType dropdown has two options: "In-house Employee" and "External Service"When "External Service" is selected, "Courier/Postal Service Name" field becomes mandatoryDispatch Date field accepts format "dd-mm-yyyy" and is optionalAreas with "Unassigned" status can be assigned; already assigned areas require reassignment confirmationProgress tracking begins only after assignment is completedSystem automatically updates "Updated By" field with current user nameSystem automatically updates "Updated On" field with current timestamp
Validation and Error Handling Rules:
Print Date validation prevents dates more than 30 days in the past or futureStatus changes require confirmation if they affect downstream processesVendor assignment changes trigger notification to affected partiesDistribution assignment failures generate alerts for manual resolutionMissing contact information triggers automated data enrichment workflows where possibleFailed distribution attempts are retried automatically up to 3 times before manual interventionBulkmass assignment operationsvalidateacross multiple territories- Geographic hierarchy: Area → Sub-Area → Premises → Bills
- Assignment flexibility: Internal employees vs external services
- Progress tracking: Real-time completion monitoring
- Resource management: Workload distribution across territories
- Audit capability: User and timestamp tracking for all
selected areas before processingchanges ExternalBulkserviceoperations:providerEfficiencynamesformustlarge-scaleexist in the approved vendor directoryassignments
Business Rules Implied
8. Sample Data
Printing Dashboard Metrics:
- Dashboard Summary: Pending Print Start: 5, Printing in Progress: 3, Printed Today: 12, Average Processing Time: 2.5 days, Delayed Print Alerts: 2
Billing Cycle Details:
- January 2025
- Billing Period: 01/01/2025 - 31/01/2025
- Total Bills: 1250
- Print Date: 05 Feb 2025
- Completion Date: - (not completed)
- Status: Pending
- Print By: Unassigned
- Lapsed Days: 131 days
- February 2025
- Billing Period: 01/02/2025 - 28/02/2025
- Total Bills: 1300
- Print Date: 05 Mar 2025
- Completion Date: - (not completed)
- Status: Pending
- Print By: Unassigned
- Lapsed Days: 105 days
- December 2024
- Billing Period: 01/12/2024 - 31/12/2024
- Total Bills: 1200
- Print Date: 05 Jan 2025
- Completion Date: - (not completed)
- Status: In Progress
- Print By: Vendor A
- Lapsed Days: 167 days
Distribution Channel Data:
- Email: 950/0/0 (Attempted/Delivered/Read)
- SMS: 800/0/0
- WhatsApp: 650/0/0
- Paper: 450/0/0
- Notification: 350/0/0
Consumer Distribution Summary:
- Total Consumers: 1250
- Fully Delivered: 1150 (92%)
- At Least One Delivered: 1200 (96%)
- Failed All: 50 (4%)
- Missing Contact: 25 (2%)
Individual Consumer Examples:
- John Smith (CS001, BN2025010001, $120.50)
- Opted Channels: Email, SMS, Paper
- Sent: Email, SMS, Paper
- Delivered: Email, Paper
- Read: Email
- Failed: - (none)
- Alice Johnson (CS002, BN2025010002, $85.75)
- Opted Channels: Email, WhatsApp
- Sent: Email, WhatsApp
- Delivered: Email, WhatsApp
- Read: WhatsApp
- Failed: - (none)
- Bob Williams (CS003, BN2025010003, $150.25)
- Opted Channels: SMS, Paper
- Sent: - (none)
- Delivered: - (none)
- Read: - (none)
- Failed: SMS, Paper
Paper Distribution Area Data:
- Central District - Central-A
- Premises: 280 premises, 320 bills
- Sub-Area Bills: 105 premises, 120 bills
- Status: Assigned (In-house)
- Assigned To: John Smith (In-house)
- Progress: 45/120 (38%)
- Updated By: Admin User
- Updated On: 2025-01-15 14:30
- Central District - Central-B
- Premises: 280 premises, 320 bills
- Sub-Area Bills: 88 premises, 100 bills
- Status: Assigned (External)
- Assigned To: India Post (External)
- Progress: 100/100 (100%)
- Updated By: System Admin
- Updated On: 2025-01-14 16:45
- North Zone - North-A
- Premises: 185 premises, 210 bills
- Sub-Area Bills: 92 premises, 105 bills
- Status: Assigned (In-house)
- Assigned To: Alice Johnson (In-house)
- Progress: 105/105 (100%)
- Updated By: Manager
- Updated On: 2025-01-13 10:20
9. Acceptance Criteria
- The system must display accurate real-time counts for Pending Print Start, Printing in Progress, and Printed Today metrics
- The system must calculate Average Processing Time based on completed cycles within the current reporting period
- The system must identify and count Delayed Print Alerts based on configurable lapsed days threshold
- The system must allow users to update printing status through a modal interface with Print Date, Status, Vendor, and Lapsed Days fields
- The system must automatically calculate Lapsed Days as the difference between current date and Print Date for non-completed cycles
- The system must enforce status progression workflow preventing backward status changes (Pending → Started → Completed)
- The system must provide tabbed interface switching between Printing and Distribution views
- The system must display distribution channel metrics with attempted/delivered/read counts in specified format
- The system must calculate Distribution Success Rate as percentage of successful deliveries across all channels
- The system must provide consumer-level drill-down showing individual delivery status across all channels
- The system must support bulk assignment of distribution areas with checkbox selection
- The system must provide Assignment Type dropdown with "In-house Employee" and "External Service" options
- The system must require Courier/Postal Service Name when External Service assignment type is selected
- The system must allow optional Dispatch Date selection with date picker in dd-mm-yyyy format
- The system must automatically populate Updated By and Updated On fields when assignments are made
- The system must display progress bars showing distribution completion percentage for each assigned area
- The system must provide search, sort, filter, and export functionality for all data tables
- The system must log all status changes and assignments with user identification and timestamp
- The system must prevent vendor assignment modifications without appropriate user permissions
- The system must validate all form inputs and provide clear error messages for invalid data entries
10. Process Changes
Current Process | New Process | Impact |
|---|---|---|
Manual tracking of printing status through email/phone communication with vendors | Real-time printing status updates through integrated dashboard interface | 85% reduction in communication overhead; immediate visibility into printing progress |
Separate spreadsheet-based tracking of billing cycle deadlines | Automated lapsed days calculation with visual alerts for overdue cycles | 90% improvement in deadline management accuracy; proactive identification of delays |
Vendor performance evaluation through periodic manual review | Continuous vendor performance monitoring with metrics and SLA tracking | 75% improvement in vendor accountability; data-driven vendor management decisions |
Distribution coordination through multiple disconnected systems | Unified multi-channel distribution management with single interface | 70% reduction in coordination effort; unified view of all distribution channels |
Consumer delivery issues identified reactively through customer complaints | Proactive consumer-level delivery tracking with failure identification | 60% reduction in customer complaints; 80% faster issue resolution |
Manual assignment of paper distribution routes | Geographic area-based bulk assignment with progress tracking | 50% reduction in assignment time; improved resource utilization |
Limited visibility into external service provider performance | Real-time tracking of external distribution partner progress and completion | 65% improvement in external partner management; enhanced SLA compliance |
Ad-hoc reporting and analytics generation | Automated dashboard metrics with real-time performance indicators | 80% reduction in manual reporting effort; instant access to performance insights |
11. Impact from Solving This Problem
Metric | Improvement Impact |
|---|---|
Bill Delivery Timeliness | 95% of bills delivered within SLA deadlines (improvement from 70%) |
Printing Vendor SLA Compliance | 90% improvement in vendor deadline adherence through proactive monitoring |
Consumer Complaint Reduction | 60% decrease in delivery-related customer complaints |
Multi-channel Distribution Efficiency | 40% improvement in successful delivery rates across all channels |
Operational Visibility | 100% real-time visibility into printing and distribution status |
Resource Allocation Efficiency | 35% improvement in distribution resource utilization through geographic optimization |
Process Automation | 75% reduction in manual tracking and coordination activities |
Vendor Management Effectiveness | 50% improvement in vendor performance through data-driven management |
Consumer Experience | 25% increase in customer satisfaction related to bill delivery |
Cost Reduction | 30% reduction in operational costs through process optimization and automation |
Data-Driven Decision Making | 90% of distribution decisions based on real-time analytics versus historical guesswork |
Issue Resolution Speed | 70% faster identification and resolution of distribution problems |
12. User Behavior Tracking
Event | Properties | Metrics | Insights |
|---|---|---|---|
Dashboard_View | user_id, tab_viewed, session_duration | Daily active users, Tab preference, Time spent on dashboard | Which aspects of printing/distribution require most attention? How frequently do users monitor progress? |
Status_Update | cycle_id, old_status, new_status, vendor_assigned, user_id | Status change frequency, Time between status changes, Vendor assignment patterns | How quickly do cycles progress through statuses? Which vendors are most frequently assigned? |
Lapsed_Days_Alert | cycle_id, lapsed_days, user_id, action_taken | Alert frequency, Response time to alerts, Action completion rate | How effective are lapsed day alerts in driving action? What threshold generates optimal response? |
Distribution_Channel_View | cycle_id, channel_type, success_rate_viewed | Channel preference analysis, Success rate awareness | Which distribution channels receive most attention? How does success rate visibility affect channel strategy? |
Consumer_Drill_Down | cycle_id, consumer_id, channels_reviewed, time_spent | Drill-down frequency, Investigation depth, Issue identification rate | How thoroughly are consumer-level issues investigated? Which delivery patterns trigger deeper analysis? |
Bulk_Assignment | area_count, assignment_type, service_provider, user_id | Assignment efficiency, Resource allocation patterns, Provider preferences | How effectively are bulk assignments used? What factors influence in-house vs external decisions? |
Vendor_Performance_Review | vendor_id, metrics_reviewed, time_spent, action_taken | Vendor monitoring frequency, Performance evaluation depth, Corrective action rate | How actively are vendor relationships managed? What performance metrics drive vendor decisions? |
Export_Report | report_type, data_range, user_id, export_format | Report generation frequency, Data consumption patterns, Format preferences | What insights are being shared externally? How is performance data being communicated? |
Search_Filter_Usage | search_term, filter_criteria, results_count, user_id | Search effectiveness, Filter utilization, Data discovery patterns | How are users finding specific information? What search patterns indicate system usability? |
Alert_Response | alert_type, response_time, action_taken, resolution_success | Alert effectiveness, Response timeliness, Resolution success rate | Which alerts drive the most effective responses? How can alert systems be optimized? |
Distribution_Assignment | area_id, assignment_type, dispatch_date_set, completion_time | Assignment patterns, Planning effectiveness, Resource optimization | How are distribution resources being allocated? What factors improve assignment success? |
Progress_Monitoring | area_id, progress_checked, current_completion, time_since_assignment | Monitoring frequency, Progress tracking effectiveness, Bottleneck identification | How actively is progress monitored? Where do distribution bottlenecks commonly occur? |
Questions answered by tracking:
- What is the average time from printing initiation to consumer delivery across different channels?
- Which vendors consistently meet deadlines and which require additional management attention?
- How does consumer contact information completeness affect successful multi-channel delivery?
- What geographic patterns exist in distribution efficiency and resource requirements?
- Which billing cycles consistently experience delays and what are the root causes?
- How effective are automated alerts in driving proactive management action?
- What is the optimal balance between in-house and external distribution resources?
- How does real-time visibility impact overall billing operation efficiency and customer satisfaction?
Wireframe
Wireframe: Link
Reference: Link