User Story: Financial Asset Management Dashboard (AX01US02)
1. Problem Statement
The Asset Manager is responsible for the financial lifecycle of all utility assets, from budget allocation to replacement and disposal. However, they lack a consolidated view that connects financial performance to asset operations, making it difficult to control costs, optimize spending, and justify financial decisions.
Key Pain Points:
- Siloed Financial Data: Financial information like CapEx, OpEx, and maintenance spend is tracked in separate systems from operational data, preventing a holistic view of asset performance.
- Poor Cost Control: Difficulty in tracking budget vs. actual spend in real-time, leading to budget overruns and reactive financial management.
- Hidden Cost Drivers: Inability to easily identify which specific assets or activities are incurring the highest maintenance costs or driving unplanned emergency repairs.
- Ineffective Long-Term Planning: Struggling to forecast future financial needs for asset replacement without a clear view of assets approaching the end of their lifecycle and their associated costs.
Core Problem: The lack of a unified financial dashboard prevents the Asset Manager from proactively managing asset-related expenditures, optimizing the balance between capital and operational costs, and making data-driven financial plans that maximize the value of every dollar spent.
2. Who is the User Facing the Problem?
Primary User: Asset Manager
This individual is responsible for the financial stewardship of the utility's asset portfolio. Their duties include developing capital and operational budgets, controlling maintenance expenditures, analyzing lifecycle costs, and ensuring that financial resources are allocated efficiently to support asset reliability and strategic goals.
3. Jobs To Be Done
For the Asset Manager:
When I need to present our quarterly financial performance to the executive board,
But I have to manually consolidate data from accounting, maintenance, and operations systems to explain our spending,
Help me by creating a single dashboard that visualizes all key financial metrics—from high-level budget variance to specific high-cost assets,
So that I can clearly communicate our financial position, justify our spending decisions, and proactively plan for future costs.
4. Solution
The solution is a comprehensive Financial Dashboard tailored to the needs of the Asset Manager. This dashboard will provide a real-time, multi-faceted view of all financial aspects of the asset portfolio, enabling effective cost control, budget management, and strategic financial planning.
Key Capabilities:
- Financial Health Overview: Presents high-level financial KPIs at a glance: Total Asset Value, Budget Variance, Maintenance Spend, and Emergency Repair costs.
- Expenditure Tracking (CapEx vs. OpEx): Provides a clear breakdown of Capital and Operating Expenditures for the current period and year-to-date, with detailed sub-categories.
- Maintenance Cost Analysis: Offers a detailed breakdown of maintenance costs, including Planned vs. Unplanned spending and a "Maintenance % of Asset Value" metric to benchmark performance.
- Lifecycle & Efficiency Metrics: Visualizes long-term costs through "Asset Lifecycle Cost" and tracks key performance indicators like "Preventive vs. Reactive" maintenance and "Cost per Unit Treated."
- Budget vs. Actual Monitoring: Includes a dedicated chart to track CapEx and OpEx budget performance, immediately highlighting any over or under-spending.
- Actionable Cost Insights: Features watchlists for "High Maintenance Cost Assets" and "Assets Approaching Replacement" to proactively identify and manage major cost drivers.
- Asset Disposal Tracking: Monitors the financial value recovered from disposed assets, completing the financial lifecycle view.
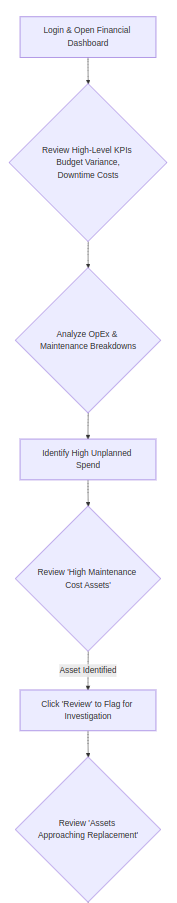
5. Major Steps Involved (Asset Manager Workflow)
- Monthly Financial Review: The Asset Manager opens the Financial Dashboard to prepare for their monthly review meeting. They immediately see a positive Budget Variance of +8.5%, but also high Downtime Costs ($125K).
- Investigate Cost Drivers: They examine the OpEx breakdown and see that "Routine Maintenance" is a major component. The Maintenance Cost Breakdown shows that Unplanned spend ($89K) is a significant portion (31%) of the total.
- Identify Problem Assets: The manager looks at the "High Maintenance Cost Assets" list and sees that "Pump Station #4" is costing $12K per month. They click "Review" to flag this for the O&M Manager to investigate for a potential replacement or overhaul.
- Plan for Future Costs: They shift their focus to the "Assets Approaching Replacement" list. They see "Main Water Pump #1" needs replacement soon at a cost of $125K. They click "Plan Budget" to add this projected cost to the next fiscal year's CapEx forecast.
- Report on Performance: The manager uses the "Budget vs. Actual Spend" chart and the "Cost Efficiency Metrics" to build their report, concluding that while the overall budget is on track, a strategic investment in replacing Pump Station #4 could reduce unplanned costs and improve efficiency.
6. Flow Diagram
7. Business Rules
General Dashboard Business Rules
These rules apply to the entire Financial Dashboard.
- Data Refresh Cadence: Financial data, especially actual spending, must be refreshed at least once every 24 hours from the source accounting and maintenance systems. A "Last Updated" timestamp should be clearly visible.
- Default View: On loading, the dashboard will default to showing data for the Current Month and Fiscal Year-to-Date (YTD).
- Currency Formatting: All monetary values must be displayed in a summarized format (e.g., $12.4M, $284K) for readability. The full value should be visible on hover via a tooltip.
- Interactivity: All widgets and KPI cards are interactive. Clicking on a segment (e.g., "CapEx - Year to Date," "High Maintenance Cost Assets") will filter the entire dashboard or navigate to a detailed report for that segment. A "Clear Filters" or "Reset View" button must be available.
- Trend Indicators: Trend indicators (e.g., ↑, ↓) compare the current period's performance against a baseline. For budget-related metrics, the comparison is against the planned budget. For cost metrics, it's against the previous equivalent period.
- Hover & Tooltips: Hovering over any interactive element will change the cursor to a pointer and provide a visual cue. Every dynamic data element, especially financial metrics, will have a tooltip explaining its meaning and calculation.
- Permissions: Access to this dashboard is restricted to users with financial oversight roles, such as "Asset Manager," "Financial Controller," and executive leadership.
Filter Options
The dashboard must provide the following filtering capabilities:
- Date Range Filter:
- Functionality: Controls the time period for which all financial data is displayed.
- Default Value: "Current Month."
- Options:
- Current Month
- Last Month
- Current Quarter
- Last Quarter
- Fiscal Year-to-Date (YTD)
- Last Fiscal Year
- Custom Range (with a start and end date picker).
- Business Rule: All metrics, trends, and lists on the dashboard will recalculate based on the selected date range.
- Hierarchy Filter (Facilities, Systems, Networks):
- Functionality: Allows the user to focus the financial view on a specific part of the asset portfolio.
- Options: A multi-select dropdown to choose one or more Facilities, Systems, or Networks.
- Business Rule: When a filter is applied (e.g., a specific Facility is selected), all financial metrics (CapEx, OpEx, Maintenance Spend, etc.) will recalculate to show data only for the assets within that selected hierarchy.
Detailed Business Rules by Dashboard Section
1. Top Navigation Tabs
- Fields: Overview, Financial, O&M, Energy, Inventory, Compliance.
- Business Rules:
- The "Financial" tab is the currently selected view. It must be visually distinct from the other tabs.
- Each tab navigates the user to a different dashboard focused on that specific domain.
2. Financial KPIs (Top Row)
This section provides a high-level summary of the portfolio's financial health.
Field Name | Business Rules & Formula | Tooltip Content |
|---|---|---|
Total Asset Value | Value ($12.4M): The current book value of all assets in the portfolio. | Title: Total Asset Value |
Replacement Value | Value ($18.8M): The estimated cost to replace all assets in the portfolio today. | Title: Replacement Value |
Budget Variance | Value (+8.5%): The percentage difference between budgeted spend and actual spend for the period. | Title: Budget Variance |
Maintenance Spend | Value ($284K): Total actual cost of all maintenance activities for the selected period. | Title: Maintenance Spend |
Emergency Repairs | Value ($45K): The portion of maintenance spend that was for unplanned, emergency repairs. | Title: Emergency Repairs |
3. Annual Depreciation
This widget shows the total depreciation charge for the year and breaks it down.
- Fields: Total Annual Depreciation, Breakdown by Asset Class.
- Business Rules:
- Total Value ($1.3M): Represents the total depreciation expense for the current fiscal year.
- Formula:
SUM(Annual Depreciation Charge)for all assets.
- Formula:
- Breakdown: The list below the total shows the sum of depreciation for the top 5 asset class, providing insight into where asset value is decreasing the most.
- Total Value ($1.3M): Represents the total depreciation expense for the current fiscal year.
- Tooltip Content: On hover over the total: "The total accounting depreciation expense for all assets for the current fiscal year." On hover over a category: "Total annual depreciation for all assets in the [Asset Class]."
4. Capital Expenditure (CapEx) & Operating Expenditure (OpEx)
These widgets provide a clear view of the two main types of spending.
Widget / Field | Business Rules & Formula | Tooltip Content |
|---|---|---|
Capital Expenditure (CapEx) | Current Period ($850K): | Title: Capital Expenditure (CapEx) |
Operating Expenditure (OpEx) | Current Period ($650K): | Title: Operating Expenditure (OpEx) |
5. Cost Efficiency Metrics
This section displays key performance indicators related to financial efficiency.
Field Name | Business Rules & Formula | Tooltip Content |
|---|---|---|
Preventive vs Reactive | Value (72%): The percentage of maintenance work that is proactive (planned). | Title: Preventive vs Reactive Maintenance |
Cost per Unit Treated | Value ($2.45): The total operational cost to produce one unit of output (e.g., one megaliter of water). | Title: Cost per Unit Treated |
Energy Efficiency | Value (89%): A measure of how efficiently energy is being used. | Title: Energy Efficiency |
6. High Maintenance Cost Assets & Assets Approaching Replacement
These are actionable watchlists that drive cost-saving activities.
Widget / Field | Business Rules & Formula | Tooltip Content |
|---|---|---|
High Maintenance Cost Assets | Functionality: A list of the top 5 assets with the highest accumulated maintenance costs in the selected period. | Title: High Maintenance Cost Asset |
Assets Approaching Replacement | Functionality: A prioritized list of assets nearing the end of their useful life or flagged for replacement. | Title: Asset Approaching Replacement |
8. Sample Data
Asset Name | Monthly Cost | Type | Status | Replacement Cost |
|---|---|---|---|---|
Pump Station #4 | $12K | High Maintenance | Review | $250,000 |
Main Water Pump #1 | $2K | Approaching Replacement | High Priority | $125,000 |
Treatment Plant #2 | $9K | High Maintenance | Review | $5,000,000 |
Backup Generator #3 | $1K | Approaching Replacement | Medium Priority | $85,000 |
9. Acceptance Criteria
- The system must display the Total Asset Value based on the current book value.
- The system must calculate and display the Budget Variance as a percentage.
- The system must show separate totals for CapEx and OpEx for the current period and year-to-date.
- The system must break down Maintenance Cost into Planned and Unplanned spending.
- The system must calculate and display the "Maintenance % of Asset Value."
- The "Budget vs Actual Spend" chart must accurately visualize spending against the allocated budget for both CapEx and OpEx.
- The system must display the total Asset Disposal Value for the current period and year-to-date.
- The system must display the three "Cost Efficiency Metrics": Preventive vs Reactive, Cost per Unit Treated, and Energy Efficiency.
- The "High Maintenance Cost Assets" list must display the top 5 assets ranked by monthly maintenance spend.
- The "Assets Approaching Replacement" list must display assets with a defined replacement date within the next 18 months, prioritized by cost and date.
- The "Review" button on a high-cost asset must open a detailed view or flag the asset for follow-up.
- The "Plan Budget" button must open a workflow to add a projected cost to a future budget cycle.
- All financial KPIs must have a tooltip explaining how they are calculated.
- The dashboard must load completely within 5 seconds.
- All interactive elements must provide a visual cue on hover.
10. Process Changes
From (Current Process) | To (New Process) | Impact Analysis |
|---|---|---|
Reviewing financial performance from static, month-end accounting reports. | Monitoring financial performance in near real-time through an interactive dashboard. | Enables proactive cost control and reduces the risk of budget overruns by identifying issues mid-cycle instead of after the fact. |
Unplanned maintenance costs are accepted as a cost of doing business. | Unplanned costs are actively tracked and linked back to specific "High Maintenance Cost Assets." | Shifts focus to root cause analysis, justifying strategic replacement (CapEx) to reduce long-term operational costs (OpEx). |
Budget planning for replacements is based on asset age and general estimates. | Budget planning is driven by a specific list of "Assets Approaching Replacement" with defined costs and timelines. | Improves the accuracy of capital forecasting by 20-30% and ensures funds are allocated for known future needs. |
11. Impact from Solving This Problem
Metric | How it Improves |
|---|---|
✅ Cost Control & Budget Adherence | Real-time visibility into spending and variance allows for immediate corrective action, improving budget adherence. |
✅ Reduced Operational Costs | By identifying and addressing high-cost assets, the manager can lower unplanned maintenance and downtime costs by an estimated 15-20%. |
✅ Optimized CapEx/OpEx Balance | The dashboard provides the data needed to make strategic decisions, such as investing in new assets (CapEx) to lower long-term maintenance (OpEx). |
✅ Improved Financial Forecasting | The "Assets Approaching Replacement" watchlist provides a clear pipeline of future capital needs, leading to more accurate and defensible long-range financial plans. |
12. User Behavior Tracking
Question to Answer | Event to Track | Properties |
|---|---|---|
Is the manager actively monitoring budget performance? |
|
|
What are the biggest areas of financial concern? |
|
|
Is the manager taking action on high-cost assets? |
|
|
Are the efficiency metrics being used to gauge performance? |
|
|
What is the primary focus: short-term spend or long-term planning? |
|
|