User Story: Energy Dashboard (AX01US04)
1. Problem Statement
User Role: Asset Manager (Energy Focus)
The Asset Manager responsible for energy management oversees energy consumption optimization, cost reduction initiatives, sustainability compliance, and the integration of energy efficiency considerations into asset maintenance and capital planning decisions.
Pain Points:
- Disconnected Energy and Asset Management: Energy efficiency alerts (like the 18% consumption increase at Treatment Plant #1) exist in isolation without clear connection to asset maintenance schedules, condition assessments, or work order creation.
- Reactive Energy Problem Resolution: Current interface shows energy efficiency problems after they occur but lacks predictive capabilities to prevent energy waste or integrate energy optimization into preventive maintenance planning.
- Limited Actionable Insights from Energy Data: While the dashboard shows energy consumption by facility and time-of-use analysis, it lacks intelligent recommendations for operational changes, maintenance interventions, or capital investments that could improve efficiency.
- Poor Integration Between Energy ROI and Maintenance Planning: Efficiency projects show ROI percentages (180% for LED lighting, 225% for pump optimization) but these aren't connected to asset replacement schedules, maintenance priorities, or work order management systems.
- Fragmented Sustainability and Compliance Tracking: Carbon footprint data (72.4 metric tons CO2e) and renewable energy targets exist separately from operational decisions, making it difficult to align day-to-day asset management with sustainability goals.
Core Problem:
Asset Managers need an integrated energy management system that connects energy efficiency monitoring with asset maintenance decisions, transforms reactive energy problem-solving into proactive optimization, and aligns sustainability goals with operational asset management practices.
2. Who Are the Users Facing the Problem?
Primary User: Asset Manager (Energy Focus)
- Develops energy efficiency strategies and sustainability initiatives
- Integrates energy considerations into asset maintenance and replacement decisions
- Tracks energy costs and identifies optimization opportunities
- Ensures compliance with environmental regulations and sustainability targets
- Coordinates energy-related projects with operational maintenance activities
Access Requirements:
- Full read/write access to energy management module
- Integration access to asset management, work management, and financial modules
- Dashboard configuration for energy-specific KPIs and alerts
- Advanced analytics for energy consumption patterns and efficiency projections
3. Jobs To Be Done
For Asset Manager: When I need to optimize energy consumption across utility facilities, But I have energy efficiency alerts that aren't connected to asset maintenance planning or work order systems, Help me integrate energy monitoring with maintenance scheduling so efficiency improvements are automatically incorporated into preventive maintenance activities, So that I can reduce energy costs while optimizing asset performance and extending equipment life.
For Asset Manager: When I need to prioritize energy efficiency investments and projects, But I lack integrated analysis of energy ROI, asset condition, and maintenance timing, Help me provide unified decision support that considers energy savings potential alongside asset replacement needs and maintenance schedules, So that I can maximize both energy efficiency and asset management ROI through coordinated planning.
For Asset Manager: When I need to respond to energy efficiency alerts and consumption anomalies, But I have no automated connection between energy problems and maintenance interventions, Help me create intelligent workflows that convert energy efficiency alerts into maintenance work orders with appropriate priority and resource allocation, So that I can address energy waste quickly while maintaining operational reliability.
For Asset Manager: When I need to align sustainability goals with operational asset management, But I lack integrated tracking of carbon footprint impacts from maintenance decisions and asset investments, Help me provide sustainability impact assessment for all asset management decisions with automated compliance tracking, So that I can achieve environmental targets while maintaining operational efficiency and regulatory compliance.
For Asset Manager: When I need to demonstrate energy management effectiveness and regulatory compliance, But I must manually compile data from energy monitoring and asset management systems, Help me provide automated energy performance reporting that includes asset condition correlation and maintenance impact analysis, So that I can prove energy management value and ensure environmental compliance with minimal administrative overhead.
4. Solution
Integrated Energy-Asset Management Intelligence Platform
1. Unified Energy-Asset Dashboard
- Real-time energy consumption monitoring with asset condition correlation
- Integrated efficiency alerts that automatically trigger maintenance assessments
- Energy-weighted asset priority scoring that considers both condition and consumption impact
2. Intelligent Energy-Maintenance Integration
- Automated work order generation from energy efficiency alerts with maintenance recommendations
- Energy impact assessment for all proposed maintenance activities and asset replacements
- Coordinated scheduling that optimizes both energy efficiency and maintenance effectiveness
3. Predictive Energy Optimization
- Machine learning algorithms that predict energy consumption patterns based on asset condition
- Proactive maintenance recommendations that prevent energy efficiency degradation
- Seasonal energy optimization planning integrated with maintenance schedules
4. Energy ROI and Investment Planning
- Integrated cost-benefit analysis combining energy savings with asset lifecycle costs
- Capital planning tools that prioritize energy-efficient asset replacements
- Real-time tracking of energy project ROI with maintenance cost impacts
5. Sustainability Compliance Integration
- Automated carbon footprint tracking with asset management decision impacts
- Renewable energy target monitoring with operational constraint consideration
- Environmental compliance reporting with audit trail documentation
6. Advanced Energy Analytics
- Time-of-use optimization recommendations based on asset operating patterns
- Facility-level energy benchmarking with peer utility comparisons
- Energy consumption anomaly detection with root cause analysis
7. Cross-Departmental Energy Coordination
- Integration with billing systems for energy cost allocation and rate optimization
- Coordination with operations teams for energy-efficient operational procedures
- Communication tools for energy project impacts on customer service and reliability
5. Major Steps Involved
Daily Energy Monitoring Flow:
- System Access: Log into SMART360 Energy Management dashboard
- Consumption Overview: Review total usage metrics, costs, and efficiency indicators
- Alert Assessment: Examine energy efficiency alerts and consumption anomalies
- Asset Correlation: Access integrated view of energy alerts with related asset conditions
- Maintenance Integration: Review how current maintenance schedules impact energy efficiency
- Optimization Planning: Identify opportunities for energy-maintenance coordination
- Action Implementation: Create or modify work orders to address energy efficiency issues
- Performance Tracking: Monitor energy impact of completed maintenance activities
Energy Efficiency Alert Response Flow:
- Alert Reception: Receive notification of energy consumption anomaly or efficiency degradation
- Root Cause Analysis: Access integrated asset condition data to identify potential causes
- Impact Assessment: Evaluate energy waste cost and potential maintenance solutions
- Maintenance Planning: Create work orders for energy-related maintenance interventions
- Resource Coordination: Assign appropriate technicians with energy efficiency expertise
- Execution Monitoring: Track maintenance progress and energy consumption changes
- Outcome Validation: Verify energy efficiency improvements after maintenance completion
- Knowledge Capture: Document lessons learned for predictive model improvement
Energy Investment Planning Flow:
- Opportunity Identification: Review efficiency project ROI and energy consumption trends
- Asset Integration: Correlate energy projects with asset replacement and maintenance schedules
- Cost-Benefit Analysis: Analyze combined energy savings and asset management benefits
- Priority Ranking: Integrate energy ROI with asset condition and criticality scores
- Implementation Planning: Coordinate energy projects with maintenance activities and resource availability
- Stakeholder Coordination: Communicate energy project impacts to operations and customer service teams
- Progress Monitoring: Track energy project implementation and performance metrics
- ROI Validation: Measure actual energy savings and maintenance cost impacts
6. Flow Diagram
graph TD
    A[Asset Manager - Energy Login] --> B[Energy Dashboard Overview]
    B --> C{Energy Alerts Present?}

    C -->|Yes| D[Energy Alert Response Flow]
    C -->|No| E[Daily Energy Monitoring]

    D --> D1[Alert Root Cause Analysis]
    D1 --> D2[Asset Condition Correlation]
    D2 --> D3[Maintenance Work Order Creation]
    D3 --> D4[Resource Assignment & Scheduling]
    D4 --> D5[Energy Impact Monitoring]
    D5 --> F[Performance Validation]

    E --> E1[Consumption Trend Analysis]
    E1 --> E2[Facility Performance Review]
    E2 --> E3[Efficiency Project Assessment]
    E3 --> E4[Maintenance Integration Check]
    E4 --> G{Optimization Opportunities?}

    G -->|Yes| H[Energy Investment Planning]
    G -->|No| I[Routine Monitoring Complete]

    H --> H1[ROI Analysis & Asset Integration]
    H1 --> H2[Priority Ranking & Scheduling]
    H2 --> H3[Stakeholder Coordination]
    H3 --> H4[Implementation Planning]
    H4 --> H5[Progress Tracking]
    H5 --> F

    F --> J[Update Energy & Asset Records]
    I --> K[Daily Energy Report Generation]
    J --> L[Cross-System Synchronization]
    K --> L
    L --> M[Sustainability Compliance Update]
    M --> N[End Process]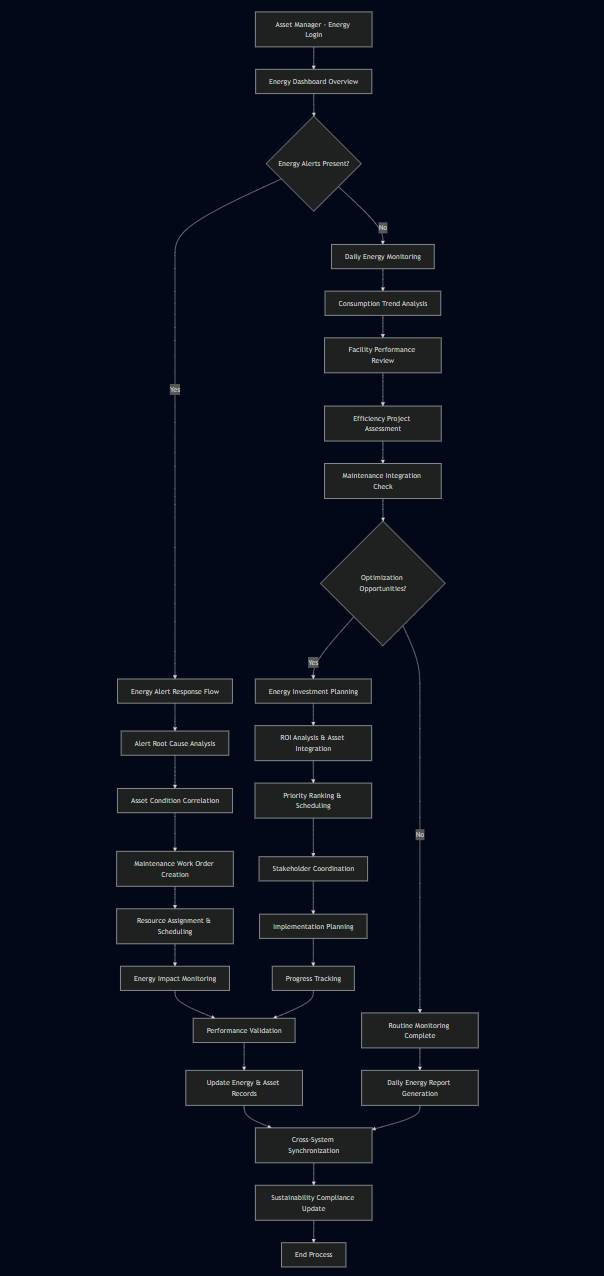
7. Business Rules
General Dashboard Business Rules
These rules apply to the entire Energy Dashboard.
- Data Refresh Cadence: Energy consumption data (kWh, cost) must be updated from utility bills and real-time meters at least daily. Critical data like Peak Demand and system status should be refreshed hourly or faster. A "Last Updated" timestamp is required.
- Default View: On loading, the dashboard will default to showing data for the "Last 30 Days" or the "Current Billing Cycle" to provide immediate, relevant context.
- Interactivity: All widgets, KPIs, and list items are interactive. Clicking a segment (e.g., "Main Treatment Plant," an "Energy Efficiency Alert") will filter the entire dashboard to that context or navigate to a detailed analysis page. A "Reset Filters" button must be available.
- Action Buttons: Buttons like "Investigate" are functional and must trigger a specific workflow, such as automatically creating a pre-populated "Investigation" work order that links the energy anomaly to the specific asset for a technician to review.
- Permissions: Access is primarily for the Asset Manager (Energy Focus), but also for Facility Managers and Financial Controllers. Permissions will control the ability to act on alerts or modify settings.
- Hover & Tooltips: Every dynamic data element will have a detailed tooltip on hover, explaining its business meaning, the period it covers, and its calculation formula.
Filter Options
The dashboard must provide the following filtering capabilities:
- Date Range Filter:
- Functionality: Controls the time period for all displayed energy data.
- Default Value: "Last 30 Days."
- Options: This Month, Last Month, This Quarter, Last 90 Days, Year-to-Date, Custom Range.
- Business Rule: All KPIs, trends, and lists will recalculate based on the selected date range.
- Hierarchy Filter (Facility):
- Functionality: Allows the user to focus the energy view on a specific facility or a group of facilities.
- Options: A multi-select dropdown to choose one or more Facilities.
- Business Rule: When a facility is selected, all dashboard widgets will recalculate to show data only for that location, allowing for focused analysis.
Detailed Business Rules by Dashboard Section
1. Top Navigation Tabs
- Fields: Overview, Financial, O&M, Energy, Inventory, Compliance.
- Business Rules:
- The "Energy" tab is the active view and must be visually distinct (e.g., underlined, different color).
- Each tab navigates to the corresponding high-level dashboard.
2. Primary Energy KPIs (Top Row)
This section provides a high-level summary of energy performance.
Field Name | Business Rules & Formula | Tooltip Content |
|---|---|---|
Total Usage | Value (145,230 kWh): The sum of all energy consumed across the portfolio for the selected period. | Title: Total Usage |
Energy Cost | Value ($18,650): The total cost of the energy consumed. | Title: Energy Cost |
Peak Demand | Value (2,450 of 2,800 kW): The highest level of electricity demand reached during the period, shown against the facility's contracted peak capacity. | Title: Peak Demand |
3. Secondary KPIs (Second Row)
Field Name | Business Rules & Formula | Tooltip Content |
|---|---|---|
Cost Per Unit | Value ($0.128 per kwh): The average cost paid for each kilowatt-hour of electricity. | Title: Cost Per Unit |
Budget Usage | Value (15.7% of budget): The percentage of the total annual opex budget that has been consumed to date. | Title: Budget Usage |
Demand Charges | Value ($3,260 this period): The portion of the energy bill related to peak demand, not just consumption. | Title: Demand Charges |
4. Energy Consumption by Facility
- Functionality: A ranked list of facilities by their energy consumption for the period.
- Business Rules:
- The list is sorted descending by energy consumption (kWh).
- Each row displays:
- Facility Name: The common name of the facility.
- Percentage Bar: A visual representation of that facility's consumption as a percentage of the total portfolio usage.
- Consumption (kWh): The total kWh used by that facility in the period.
- Cost ($): The total energy cost for that facility in the period.
- Clicking on any facility will filter the entire dashboard to show data only for that location.
- Data Source: Energy meters and billing data, aggregated by facility.
- Tooltip Content: On hover over a facility: "This facility accounts for [X]% of the total energy consumption. Click to view a detailed energy profile for this location."
5. Monthly Energy Trends
- Functionality: A visual summary of energy consumption and cost over the last 6 months.
- Business Rules:
- Each card represents a month.
- It displays the total energy consumption (kWh) and the total cost ($) for that month.
- This allows the user to quickly spot seasonal trends or recent deviations from the norm.
- Data Source: Historical energy billing data.
- Tooltip Content: On hover over a month: "In [Month], total consumption was [X] kWh at a cost of [Y]. Click to view the detailed dashboard for this month."
6. Backup Energy Systems & Energy Efficiency Alerts
Widget / Field | Business Rules & Formula | Tooltip Content |
|---|---|---|
Backup Energy Systems | Functionality: A status board for critical backup power systems. | Title: Backup System Status |
Energy Efficiency Alerts | Functionality: An actionable watchlist of assets or facilities showing abnormal energy consumption. | Title: Energy Efficiency Alert |
8. Sample Data
Energy Efficiency Alert Sample:
Alert ID: ENERGY-001
Facility: Treatment Plant #1
Alert Type: Consumption Increase
Severity: Medium (+18% above baseline)
Related Assets: Filtration Pumps (ID: PUMP-101, PUMP-102)
Estimated Waste: 450 kWh/month = $54 potential savings
Recommended Action: Schedule pump motor inspection
Asset Condition: Pump motor bearings 6 months overdue for maintenance
Energy Project Sample:
Project: LED Lighting Upgrade - Admin Building
Current Consumption: 18k kWh/year
Projected Consumption: 12k kWh/year
Energy Savings: 33% reduction
ROI: 180% over 3 years
Related Assets: Lighting circuits (LT-001 through LT-045)
Maintenance Impact: Reduced lighting maintenance by 60%
Carbon Reduction: 4.2 metric tons CO2e annually
Facility Energy Profile Sample:
Facility: Main Treatment Plant
Total Consumption: 52k kWh/month
Cost per kWh: $0.128
Monthly Cost: $6,760
Efficiency Rating: 78% (Below 85% target)
Primary Consumers: Treatment pumps (40%), Aeration systems (35%)
Maintenance Correlation: 23% of energy waste linked to deferred maintenance
Time-of-Use Optimization Sample:
Rate Period: Peak Hours (2PM-8PM)
Current Usage: 33k kWh @ $0.21/kWh = $6,825
Off-Peak Alternative: 23k kWh @ $0.11/kWh = $2,860
Potential Savings: $3,965/month
Operational Constraints: Treatment demand requirements, pump scheduling
Asset Requirements: Variable speed drives, automated scheduling systems
9. Acceptance Criteria
- The system must display real-time energy consumption data integrated with asset condition indicators for all monitored facilities.
- The system must automatically generate energy efficiency alerts when consumption exceeds baseline by more than 10% for 3 consecutive hours.
- The system must create maintenance work orders automatically when energy alerts correlate with known asset condition issues.
- The system must provide integrated ROI analysis that combines energy savings with asset maintenance cost impacts.
- The system must track carbon footprint changes resulting from energy efficiency improvements and asset management decisions.
- The system must integrate energy project planning with asset maintenance schedules to optimize implementation timing.
- The system must provide time-of-use optimization recommendations that consider operational constraints and asset capabilities.
- The system must validate energy savings within 90 days of project completion and update predictive models accordingly.
- The system must generate automated sustainability compliance reports with energy and asset management correlation.
- The system must provide facility-level energy benchmarking with peer utility comparisons and improvement recommendations.
- The system must integrate with billing systems to provide energy cost allocation and rate optimization analysis.
- The system must support predictive energy consumption modeling based on asset condition and maintenance schedules.
- The system must provide mobile access for field technicians to view energy impact information during maintenance activities.
- The system must maintain 99.5% uptime for energy monitoring with automatic failover to backup data sources.
- The system must process energy consumption data updates within 15 minutes during peak monitoring periods.
- The system must validate energy efficiency calculations and prevent erroneous work order creation through automated checks.
- The system must provide customizable energy dashboards for different management levels and responsibilities.
- The system must support batch processing of energy efficiency assessments for large-scale maintenance planning.
- The system must integrate renewable energy generation data with consumption monitoring for net energy analysis.
- The system must provide emergency energy management protocols that automatically adjust asset operations during peak demand periods.
10. Process Changes
Current Process | New Process | Impact Analysis |
|---|---|---|
From: Manual review of energy consumption reports separate from asset maintenance planning To: Integrated energy-asset dashboard with automated correlation between consumption patterns and asset conditions | Reduces energy waste identification time by 75% and improves maintenance targeting by correlating energy efficiency with asset health | |
From: Reactive response to energy efficiency problems after significant waste occurs To: Proactive energy monitoring with predictive maintenance integration and automated alert generation | Prevents 60% of energy waste through early intervention and reduces emergency energy costs by 40% through predictive optimization | |
From: Separate planning for energy efficiency projects and asset maintenance schedules To: Coordinated energy-maintenance planning with integrated ROI analysis and timing optimization | Increases project ROI by 35% through coordinated implementation and reduces service disruptions by 50% through integrated scheduling | |
From: Manual calculation of energy project benefits without asset management cost considerations To: Automated cost-benefit analysis including energy savings, maintenance impacts, and asset lifecycle costs | Improves investment decision accuracy by 45% and optimizes capital allocation through comprehensive analysis | |
From: Separate sustainability reporting requiring manual data compilation from multiple systems To: Automated carbon footprint tracking with real-time energy and asset management integration | Reduces compliance reporting time by 80% and improves environmental target achievement by 30% through integrated tracking | |
From: Energy efficiency alerts handled through separate workflows without maintenance coordination To: Integrated alert response that automatically creates maintenance work orders with energy impact prioritization | Reduces energy alert response time by 65% and improves resolution effectiveness by 50% through coordinated maintenance response |
11. Impact from Solving This Problem
Metric Category | Improvement | Description |
|---|---|---|
Energy Cost Reduction | 25% decrease in total energy costs | Integrated energy-asset management prevents waste and optimizes consumption through coordinated maintenance |
Energy Efficiency | 35% improvement in facility efficiency ratings | Proactive monitoring and maintenance coordination prevents efficiency degradation and optimizes asset performance |
Carbon Footprint Reduction | 30% decrease in CO2e emissions | Energy optimization and efficient asset operations reduce environmental impact while maintaining service levels |
Maintenance ROI | 40% improvement in energy-related maintenance effectiveness | Coordinated planning ensures maintenance activities address both asset condition and energy efficiency simultaneously |
Project Implementation Speed | 50% faster energy efficiency project deployment | Integrated planning with asset maintenance schedules reduces implementation time and service disruptions |
Predictive Accuracy | 70% improvement in energy consumption forecasting | Machine learning integration with asset condition data improves prediction accuracy for planning and budgeting |
Compliance Efficiency | 85% reduction in sustainability reporting time | Automated tracking and reporting eliminate manual data compilation and improve regulatory compliance |
Alert Resolution Time | 60% faster response to energy efficiency problems | Automated correlation between energy alerts and asset maintenance enables faster, more effective interventions |
12. User Behavior Tracking
Asset Manager (Energy Focus) Tracking Plan:
Event Category | Specific Events | Properties Tracked | Key Questions Answered |
|---|---|---|---|
Energy Dashboard Usage | Login frequency, Widget interactions, Alert acknowledgments | Session duration, Feature utilization, Alert response times | How actively are energy management features being used? Which energy metrics drive the most decision-making? |
Energy-Asset Integration | Asset condition correlations, Maintenance work order creation from energy alerts | Correlation frequency, Work order conversion rates, Asset types | How effectively is energy monitoring driving asset maintenance decisions? |
Energy Efficiency Projects | Project creation, ROI analysis usage, Implementation tracking | Project types, ROI calculations, Implementation timelines | Are energy efficiency projects being properly planned and executed? What ROI thresholds drive project approval? |
Sustainability Tracking | Carbon footprint monitoring, Renewable energy target tracking, Compliance report generation | Metrics accessed, Target progress, Report frequency | How well are sustainability goals being monitored and achieved? |
Predictive Energy Management | Consumption pattern analysis, Predictive model usage, Optimization recommendations | Prediction accuracy, Recommendation adoption, Model performance | Are predictive capabilities improving energy management effectiveness? |
Cross-System Integration | Billing integration usage, Operations coordination, Maintenance scheduling alignment | Integration frequency, Coordination effectiveness, Scheduling optimization | How well is energy management integrating with other utility operations? |
Alert Response Effectiveness | Alert response times, Resolution success rates, Follow-up actions | Response times, Resolution methods, Outcome tracking | How quickly and effectively are energy efficiency problems being addressed? |
Key Insights from Tracking:
- Energy-Asset Correlation Effectiveness: Measuring how often energy alerts lead to maintenance actions indicates integration success
- Predictive Model Performance: Tracking prediction accuracy and user adoption shows the value of machine learning integration
- Sustainability Goal Achievement: Monitoring target progress and compliance efficiency demonstrates environmental management effectiveness
- Project ROI Validation: Comparing projected vs. actual energy savings validates decision-making tools and improves future planning
- Cross-Departmental Coordination: Measuring integration usage shows how well energy management supports overall utility operations
- User Engagement Patterns: Understanding feature usage helps optimize interface design and training for energy management workflows